Introduction
Unlike many Seeking Alpha readers, my portfolio is filled with ETFs and CEFs, very few individual stocks or REITs, the focus of this article. Others probably invest the same but maybe for different reasons. Mine is I trust my fund selection ability over my ability to pick winning stocks or individual REITs. Recent results within my Cash Secured Puts strategy agrees with that assessment, but that tale is for another time and article.
Using a fund strategy should be safer from suffering large losses, but one that gives up the ability to score big, too. I am okay with that, as I am at an age and asset value where small gains is all I feel I need. Plus, if I die first, a fund-oriented strategy will be easier for my investing-novice wife to handle, though we do have access to professional advice.
What all that means is when picking a fund to hold, after deciding what market segment I want more exposure to, I focus on past performance and understanding the index used, if a passive fund, to decide if I want to add that fund to my portfolio. If not, I move on to the next candidate. One screen I use is how the fund’s risk and return data compares to the premier index-based fund in that segment. That is why when reviewing the Fidelity MSCI Real Estate Index ETF (NYSEARCA:FREL), I used the Vanguard Real Estate ETF (NYSEARCA:VNQ) as its benchmark ETF to beat. It turns out they use basically the same index to invest, making it a great comparison to use.
That small index difference does affect the holdings and has resulted in the FREL ETF treating investors better than the Vanguard ETF since it started back in early 2015, but with more recent returns being a toss-up, I give both FREL and VNQ a Hold rating, though I present expert views that REITs should do well from here if historical performance occurs.
Comparing indices
Both ETFs use an index variation of the unrestricted MSCI REITs index with allocation limits compared to the unrestricted index. The indices are:
- MSCI US Investable Market Real Estate 25/50 Index (by VNQ)
- MSCI US Investable Market Real Estate 25/25 Index (by FREL)
MSCI describes each index as follows:
The MSCI US IMI Real Estate 25/50 Index is designed to capture the large, mid and small-cap segments of the U.S. equity universe. All securities in the index are classified in the Real Estate sector as per the Global Industry Classification Standard (GICS®). At the end of each quarter of its tax year, no more than 25% of the value of the RIC’s assets may be invested in a single issuer and the sum of the weights of all issuers representing more than 5% of the fund should not exceed 50% of the fund’s total assets. The methodology aims to minimize index turnover, tracking error, and extreme deviation from the parent index. The indexes are rebalanced quarterly.
Source: msci.com 25/50 Index
The MSCI US IMI Real Estate 25/25 Index captures the large, mid and small-cap segments of the US equity universe. All securities in the index are classified in the Real Estate sector according to the Global Industry Classification Standard (GICS®). The index also applies certain investment limits to help ensure diversification limits that are imposed on regulated investment companies, or RICs, under the current US Internal Revenue Code. The index restricts the weights of the group entities such that no group entity exceeds 25% of index weight and all group entities with weight above 5% cumulatively cannot exceed 25% of the index weight. The methodology aims to minimize index turnover, tracking error and extreme deviation from the parent index. The indexes are rebalanced quarterly.
Source: msci.com 25/25 index
I think the wording used in the 25/50 description is much clearer. In that index, components with a weight above 5%, when added together, can total 50% of the total index, whereas the 25/25 version caps the cumulative weight of the 5%ers at only 25% of the total index weight. I found an entire PDF that explains the nuances MSCI performs for their constrained indices.
I found data for the unconstrained version of the index plus the constrained version*. Here is how those limits are currently affecting the REIT sectors.
www.msci.com multiple PDFs; compiled by Author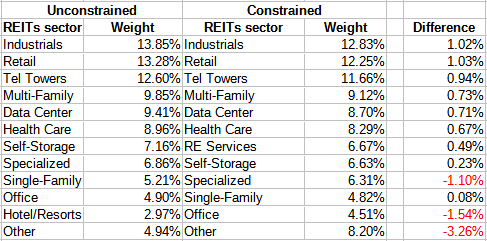
* MSCI posted the same data for both constrained, so cannot tell which it represents.
Vanguard Real Estate ETF review
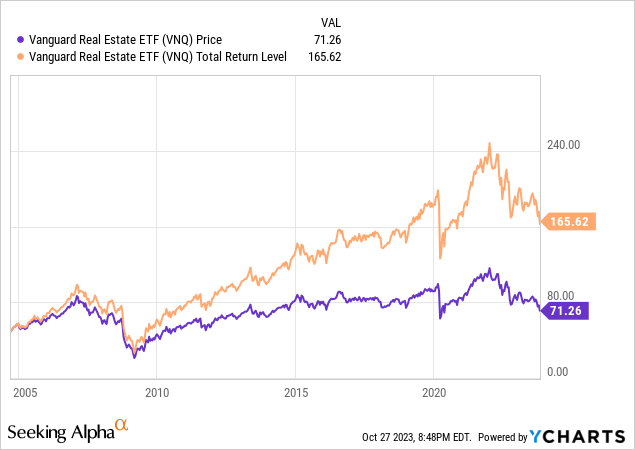
Seeking Alpha describes this ETF as:
The Vanguard Real Estate ETF invests in public equity markets of the United States. It invests in stocks of companies operating across real estate, and equity real estate investment trusts (REITs) sectors. It invests in growth and value stocks of companies across diversified market capitalization. It seeks to track the performance of the MSCI US Investable Market Real Estate 25/50 Index. VNQ started in 1996.
Source: seekingalpha.com VNQ
VNQ has $28.1b in AUM, with Vanguard charging 12bps in fees. The TTM Yield is 4.96%, with this payout history.
seekingalpha.com VNQ DVDs
Thanks to recent boosts, the 3Y CAGR has shown positive growth as opposed to the negative growth rate for the last five years. Overall, Seeking Alpha gives VNQ a “A-” grade for this factor.
seekingalpha.com VNQ scorecard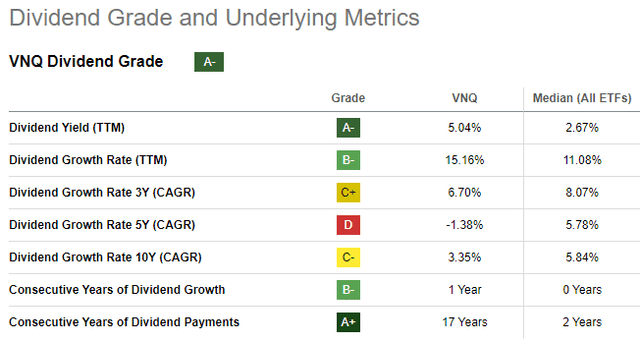
The most recent (9/30) top holdings were:
seekingalpha.com VNQ holdings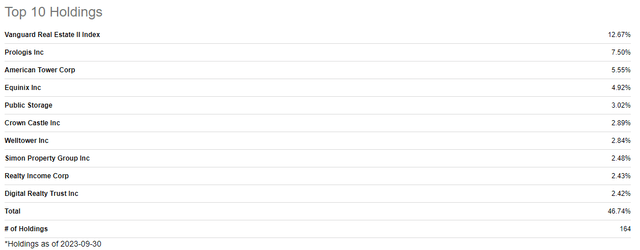
VNQ’s largest holding is another REITs fund from Vanguard. When looking at that fund, its top holdings match VNQ’s overall top holdings.
Fidelity MSCI Real Estate Index ETF review
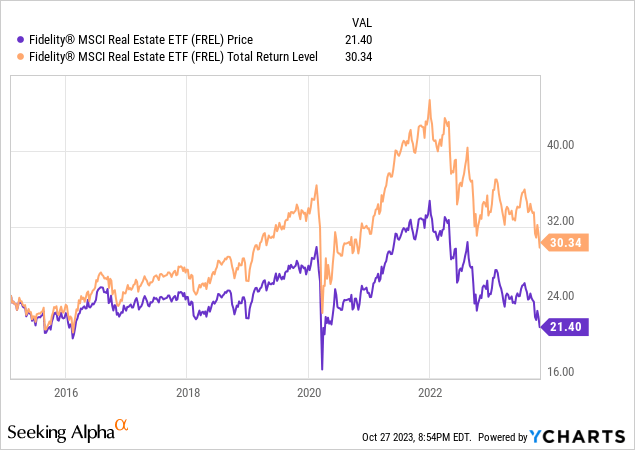
Seeking Alpha describes this ETF as:
The Fidelity MSCI Real Estate Index ETF is co-managed by BlackRock Fund Advisors. It invests in public equity markets of the United States. It invests in stocks of companies operating across real estate sectors. The fund invests in growth and value stocks of companies across diversified market capitalization. The fund seeks to track the performance of the MSCI USA IMI Real Estate 25/25 Index. FREL started in 2015.
Source: seekingalpha.com FREL
FREL has “just” $859m in AUM and has a lower fee, only 8bps. The TTM Yield is also less at 4.26%, with this payout history.
seekingalpha.com FREL DVDs
Even though both ETFs follow the same strategy with a small twist, unlike VNQ, FREL 1Y payout is down from the prior year; other data points more closely align. That difference though results in only a “B-” grade from Seeking Alpha.
seekingalpha.com FREL scorecard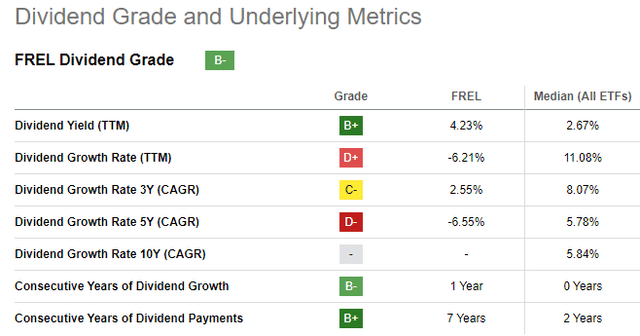
FREL had more recent holdings (10/27) data:
seekingalpha.com FREL holdings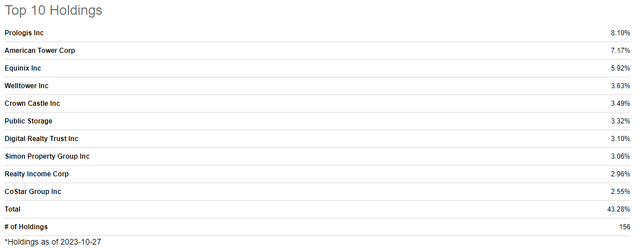
As we will see later, the two ETFs indeed invest very closely, meaning the index weight allocation limits do not play a large role.
Comparing ETFs
Since the crux of the article is this comparison, I chose to put most the holdings data here and pull each part from the same source as much as possible so the timing for each dataset is the same. That said, I needed to use the manager’s data for the sub-sectors allocations, both as of 9/30/23.
multiple pages; compiled by Author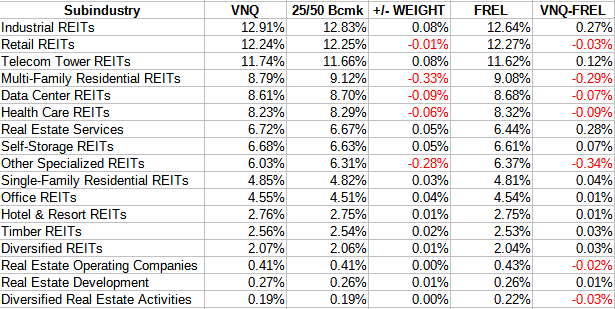
Sub-sector allocations differences don’t seem to matter in terms of risk/reward results. When comparing ratios, except for VNQ having a noticeable advantage in Sales and Cash Flow growth, again the ETFs differ little.
Morningstar.com; compiled by Author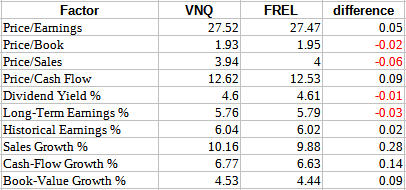
The ETFs share 94% of the same stocks and overlap by weight at 84%. The same site provides these comparisons for the biggest weight differences at the holdings level. What I do not know is if the Vanguard Real Estate II Index individual holdings were merged with the VNQ holdings for this dataset.
ETFRC.com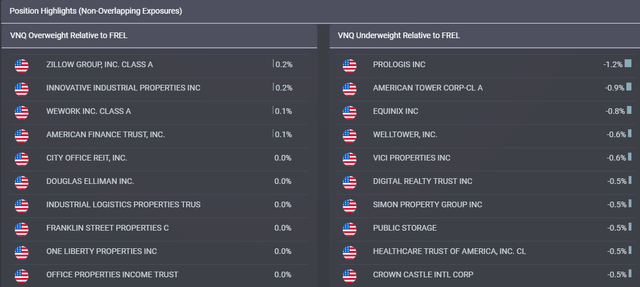
With that caveat, the overweight differences are much smaller than when VNQ is underweight which what FREL holds. Even so, the largest difference is only 1.2%.
Investing results
All of the above comparisons are what the ETFs look like recently. Being index-based, I think one can assume any movements in holdings would occur closely in each ETF. If so, FREL has performed better since it started in early 2015.
seekingalpha.com charting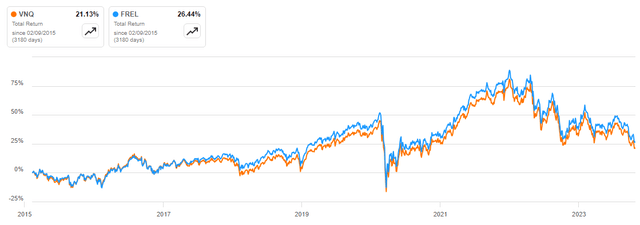
Using a slightly limited dataset, we see VNQ had a CAGR of 2.94%, versus 3.21% for FREL; 4bps of which comes from FREL’s lower fees. Looking at more recent history, it flips which is the better performing ETF.
PortfolioVisualizer.com
Over the past five years, VNQ has performed better. Looking at data prior to 2018, I saw that FREL outperformed VNQ by almost 400bps in 2017, which explains why its Full history has been better. This leads me to give both a Hold rating with preference to VNQ for income investors, and FREL for those who want the lowest fees for what is basically the same investment strategy.
Portfolio strategy
An important question to ask is: “Are REITs are good investment today and why?”. The National Association of Real Estate Investment Trusts, known as Nareit, on their website lists some reasons to own REITs and three statistics.
reit.com/nareit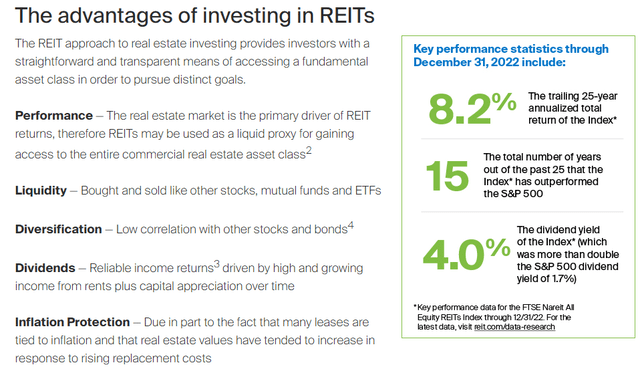
The next chart indicates that we are a good entry point into REITs from a valuation perspective.
brandassets.principal.com 
The current EV/EBITDA ratio of 5.2x only gets this good in the mist of a crisis, like COVID and the GFC. That is reflected in REITs lagging the total US stock market since COVID.
An article from Cohen & Steers list their three reasons why REITs are worth holding. These are:
- Cash flow growth for REITs have been strong and should remain resilient
- Recessions create potential entry points
- On average, listed REITs have historically outperformed broader equities following hikes to the federal funds rate
The article provides charts in support of each point, plus explaining a fourth reason they believe to REITs outperforming. For an in-depth analysis on the current state of the US REITs market, Hoya Capital published REITs Are Historically Cheap last August.
The next chart compares REITS versus all US stocks back to 1994.
PortfolioVisualizer.com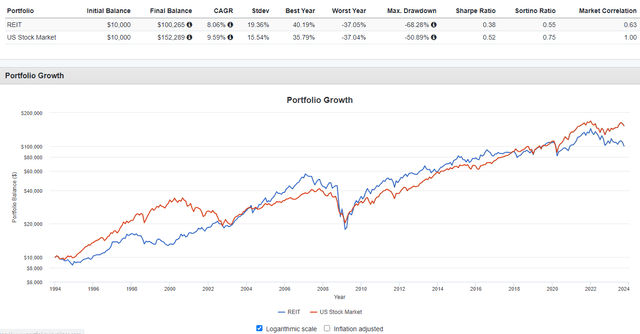
A key data point is REITs have shown only a .63 correlation to the overall US stock market. For those with access to REIT experts (not me), of which there are several writing for Seeking Alpha, there better opportunities than owning the whole REITs segment. The next chart shows performance by select REIT sub-sectors for the past five years: FREL lagged each one. (PSA was cutoff: 41.27%)
seekingaloha.com charting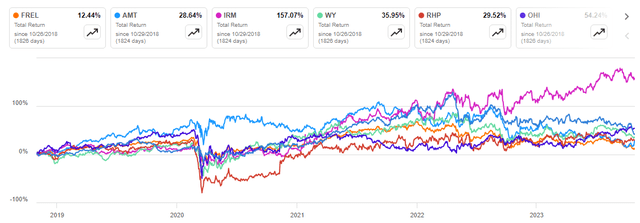
A shorter-term view also illustrates how the sectors differed in performance.
reit.com sector returns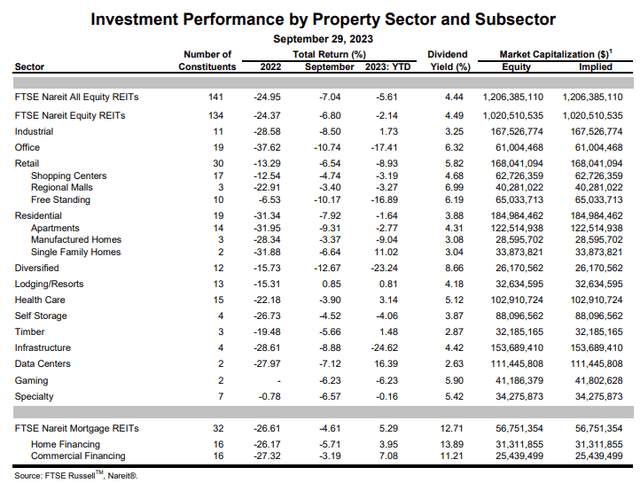
Final thoughts
So far, Real Estate stocks are next to last in 2023, only beating another interest-rate sector, Utilities.
fultonbank.com/Education-Center/FFA/Economic-Update-2023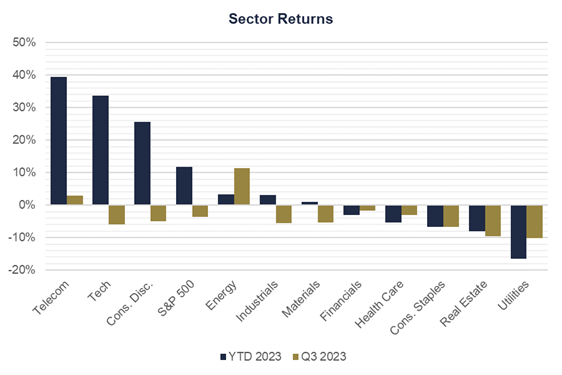
Interest rates retreating, which should start before 2025, should reverse their recent poor results if history repeats.
Occasionally I have used Seeking Alpha contributors to pick individual REITs to own, but for the most part have used REIT ETFs for my exposure, which is about 10% of my equity allocation. This strategy mirrors my overall approach of using ETFs, willing to sacrifice potential returns for what should be less risk over owning individual REITs or stocks. That is a choice all investors make, though the options are not mutually exclusive.
JR Research recently posted an article where they gave the VNQ ETF a Sell rating.
Read the full article here


