My regular readers know I have put out a slew of negative to bearish takes since summertime on the leading Big Tech names of Google/Alphabet (GOOG) (GOOGL) here, Microsoft (MSFT) here, Apple (AAPL) here, Adobe (ADBE) here, Tesla (TSLA) here, Amazon (AMZN) here, NVIDIA (NVDA) here, and Advanced Micro Devices (AMD) here. Well, if you want a trading vehicle on all the Big Tech names, with oversized leverage, why not consider selling/shorting the ProShares UltraPro QQQ ETF (NASDAQ:TQQQ)?
ProShares UltraPro QQQ is an investment designed to replicate movements in the NASDAQ 100 stocks, at a leveraged rate goal of 3x the underlying index. The downside is any price decline in this group will be magnified by 3x, and the daily costs to create the leverage are quite high. Futures with premiums to spot quotes and swap agreements with the major U.S. banks that need higher prices to offset added risk are not front-and-center ideas when technology quotes are rising. On top of this expensive situation, annual management fees 0.86% annually run on the higher end for ETFs. (I will say, today’s elevated interest rate level does allow for positive yields on its cash holdings, creating a 1.86% trailing dividend cash return for TQQQ owners as a positive development.)
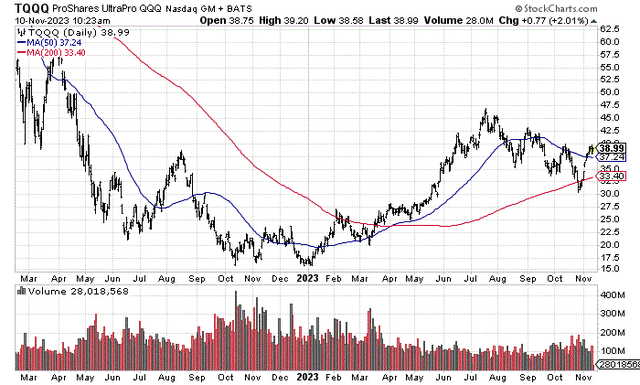
StockCharts.com – TQQQ, 21 Months of Daily Price and Volume Changes
Bearish on Big Tech?
My bearish technology sector view is largely a function of still high growth-stock valuations in a slowing economic growth backdrop does not make much rational sense. On top of my projection of recession globally into 2024, I am also quite concerned about how earnings yields (or free cash flow generation) stack up against risk-free Treasury yields and bank CD rates.
Today’s S&P 500 trailing earnings yield of 4.07% is a material failure vs. alternatives in the Treasury market. Today, you can capture 5.34% from a 1-year Treasury security and get your upfront 100% investment sum returned guaranteed. Remember the S&P 500 is now heavily weighted in Big Tech. The Magnificent 7 account for 30% of S&P 500 index value currently, a record concentration of any 7 stocks historically. Another nugget to ponder is the NASDAQ 100 earnings yield is closer to 3.5% vs. 5.34% garnered from 1-year Treasuries.
Why is this earnings yield to short-term Treasury spread worthy of more research? The last time cash investments returned dramatically better than the S&P 500 earnings yield (much less the dividend yield of 1.5%) was 1999-2000, during the original Dotcom Technology bubble peak.
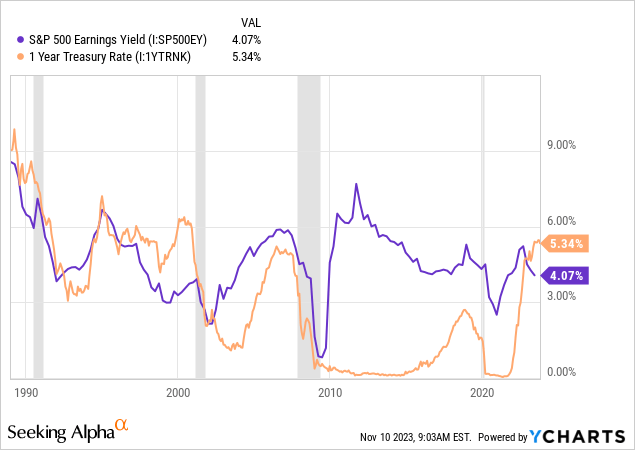
YCharts – S&P 500 Earnings Yield vs. 1-Year Treasury Bill Rate, Recessions Shaded, Since 1989
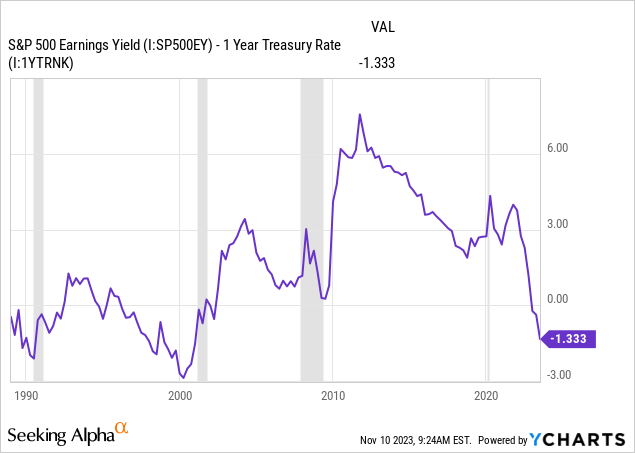
YCharts – S&P 500 Earnings Yield SPREAD vs. 1-Year Treasury Bill Rate, Recessions Shaded, Since 1989
And before that, you have to go back to 1989-90’s stock market peak and recessionary period to find a picture remotely similar to today. Interestingly, both the 1989-90 and 1999-2000 spans of topping technology sector pricing came in the face of wickedly weak “relative” performance by the financial/banking and smaller capitalization companies, just like 2023.
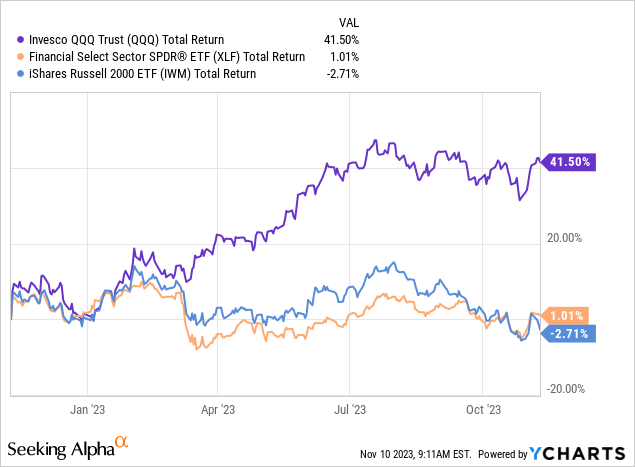
YCharts – Big Tech vs. Bank/Financial & Russell 2000 Small Cap ETFs, Total Returns, 12 Months
Following the previous 1999-2000 instance in this spread inversion, we entered a recession in economic activity, and the technology sector went through a massive bust into 2002 (-80% price decline for the QQQ product from its 2000 peak price).
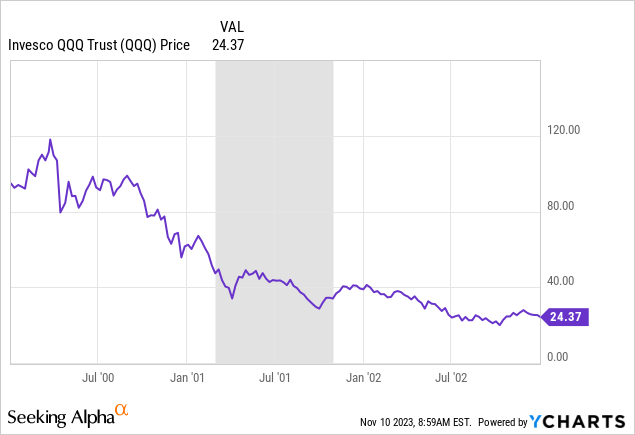
YCharts – QQQ Technology ETF, Price Change, Recession Shaded, 2000-02
Another yield problem for the Big Tech QQQ names is the actual cash distribution annually is screaming sell for long-term investors. Again, when we compare the paltry 0.6% dividend payout to 1-year Treasury rates, the allure of cash investments is abnormally strong. Today’s negative -4.75% relative spread is similar to the 2006-07 period before the Great Financial Crisis started or the 1999-2000 Dotcom bubble peak.
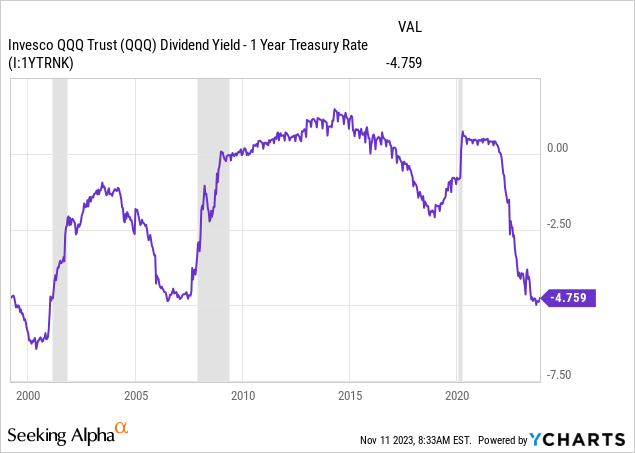
YCharts – QQQ Dividend Yield vs. 1-Year Treasury Rate, Recessions Shaded, Since 1998
The performance of QQQ was rotten between October 2007 and March 2009, falling greater than -50%. Translation: had TQQQ existed, it would have undoubtedly been one of the worst ETFs to own over this span.
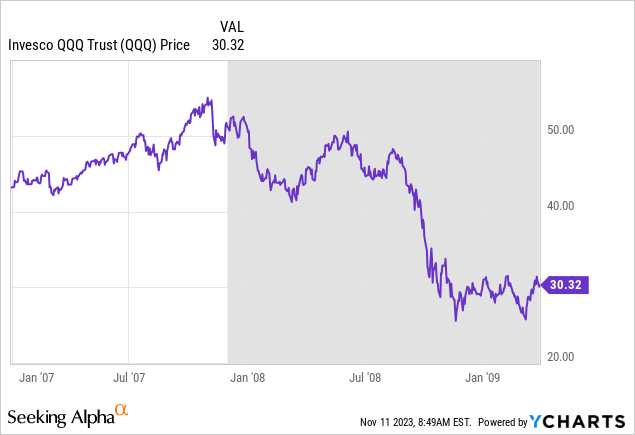
YCharts – QQQ Technology ETF, Price Change, Recession Shaded, 2007 – March 2009
TQQQ Compounding and Time Decay Issues
How does the ProShares UltraPro QQQ 3x product reprice in the real world? The daily rebalance feature actually works great in a bull market phase. You can achieve far better than the 3x design under the right circumstances, especially when a long string of up days plays out. You can see this in practice on the chart below, comparing TQQQ vs. QQQ total returns over the past 12 months. Between January and July 2023, QQQ rose +45% vs. an equivalent-period TQQQ jump of +170%, good for nearly 4x the trading profit gained by the unleveraged ETF.
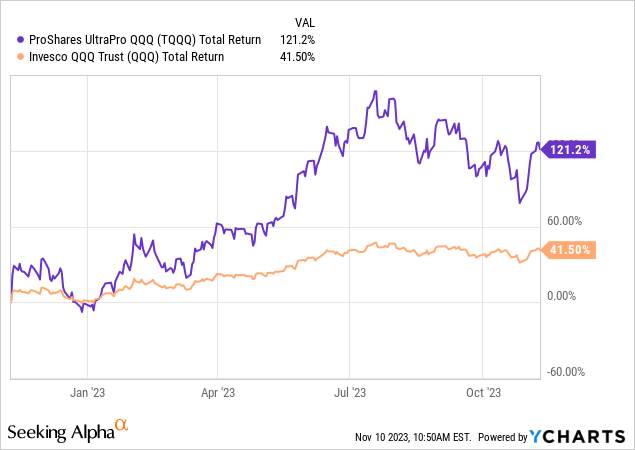
YCharts – TQQQ vs. QQQ, Total Return Changes, 12 Months
The flip side is outside of strong Big Tech advances, TQQQ actually fails miserably at rising 3x the same QQQ amount. And, when we outline a bear market drop, investors find large losses are difficult to recover from. Below is a graph of the -33% QQQ total return between January 2022 and early January 2023. The good news is TQQQ fell -79% in value, which is less than the 3x design. The bad news is investors still lost 4/5th of their money.
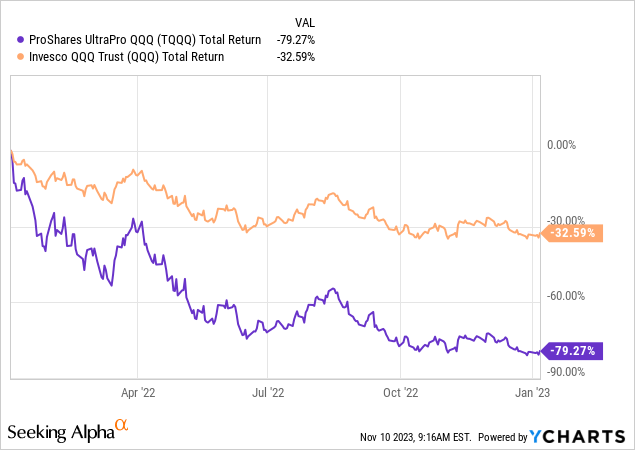
YCharts – TQQQ vs. QQQ, Total Return Changes, Jan 2022 to Early Jan 2023
Yet, if you start out with extended losses in TQQQ, compounding your money back to your original investment is truly an uphill battle. If you bought and held TQQQ from the beginning of 2022 to today, your loss in value (-54.50%) has been 9x the equivalent QQQ return (-6.79%)!
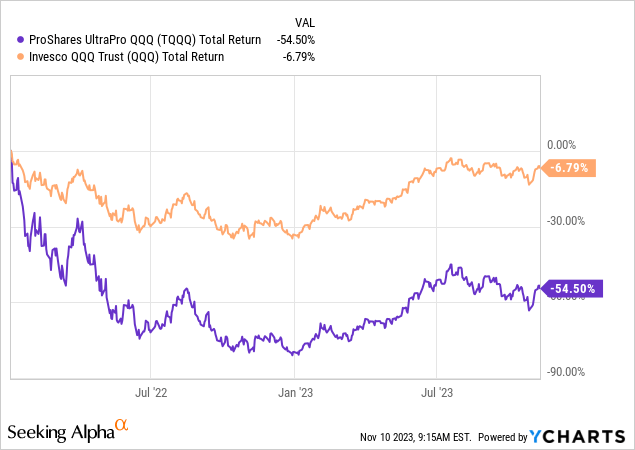
YCharts – TQQQ vs. QQQ, Total Return Changes, Jan 2022 to Present
Another look at how the daily costs to manage the fund, daily decay in leveraged contract values, and math compounding after a big drawdown work against investors is the swift 2020 bear market zigzag (caused by COVID-19 pandemic fears and equity selling).
Despite moving higher into February first, measured from January 1st, 2020, the horrible -30% QQQ drop (top to bottom) into late March, followed by a rapid rebound in April, didn’t produce the desired return for TQQQ owners. Over this bearish span, TQQQ performed 7x worse than the no-leverage QQQ.
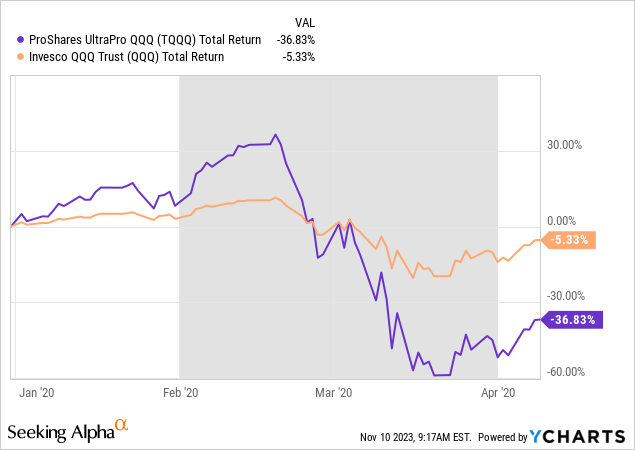
YCharts – TQQQ vs. QQQ, Total Return Changes, Jan 2020 to Early April 2020
Final Thoughts
So, if the plain vanilla QQQ can decline -80% in practice (using the 2000-02 experience), the ProShares UltraPro QQQ design could approach a far greater loss (depending on the pattern of decline, price decay/costs in hedging contracts, and interest rates on cash). Since TQQQ did not exist during the early 2000 Tech bust, many newbie investors since the spring of 2023 remain unaware of how large the losses could be in a future tech wreck.
I did write a ProShares UltraPro QQQ warning article on April 21st, 2021 here. While the Big Tech market would continue higher until the end of 2021, a buy-and-hold approach to owning this leveraged long ETF has not played out well for investors. Leveraged ETF problems with mathematical compounding after the major price loss in 2022, combined with high net costs to create and run the product, have become quite apparent for bullish investors. Another oversized selloff in the group will undoubtedly cause assets under management at TQQQ (around $17 billion today) to plunge both from backpedaling price (underlying value) and investor liquidations on monster losses.
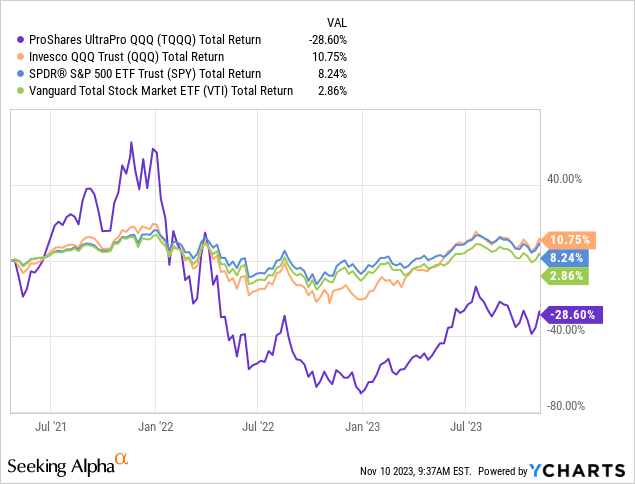
YCharts – TQQQ vs. QQQ, SPY, IWM ETFs, Total Return Changes, Since April 21st, 2021 Article
How could I be proven wrong, and the Big Tech rise continue next year? You really have to believe in goldilocks fairy tales. Geopolitical risks need to go away soon. Peace has to break out between Russia/Ukraine and in the Middle East over the Hamas attack on Israel. China and Taiwan have to become good friends.
We have to avoid a recession next year, which is incredibly unlikely in my research. There is so much evidence of a looming recession, from incredible credit contraction (total bank credit is negative YoY since the summer, first time since 2009 Great Recession), inverted yield curves (Treasury in particular since last October), rising consumer delinquencies on loans, climbing business bankruptcy numbers, and even increasing unemployment rates, soft landing “hopes” are just that.
And, most importantly, interest rates need to back up and become more supportive of growth-stock valuations again. If I can capture 5%+ cash investment yields guaranteed, why bother owning Big Tech names with 2% to 4% earnings yields for 2024, and tons of potential downside in stock pricing?
My bottom line for investors: projecting a -90% ProShares UltraPro QQQ total return decline in a Big Tech wreck over a prolonged span of several years is not rocket science. And, because of compounding issues, a recovery beyond a net -50% net loss level from purchases today could take 5-10 years, if it ever happens.
One of the mainstream ideas floating around the U.S. financial media in early November is one last upmove for the U.S. stock market will occur before another major price drop. The argument goes investors are too bearish right now to allow for a meaningful market slide. (I usually agree with this analysis and conclusion, by the way.)
Nevertheless, I will say investor sentiment surveys in 1990 and 2008 were about the same as today. Neither instance of skittish investor outlooks prevented a recession or bear market selloff from happening. Sometimes, a weakening economy overrules all other variables. If we are entering such a period into and during 2024, you will not want anything to do with QQQ or TQQQ.
Remember, before the 1990s technology boom, dividend yields reinvested typically accounted for fully 40% of stock market gains (simplified as 4% dividend yield, 6% price appreciation for annualized total returns). Since the early 1990s, Wall Street has turned into a money printing game, supported by an unnaturally low interest rate environment from the Federal Reserve bank. If we are returning to a higher inflation and interest rate period like the 1970s-80s, QQQ’s trailing dividend yield of 0.6% is an abject failure.
Consequently, I rate TQQQ a Strong Sell and Avoid. If you own it, I suggest lightening up on your position size, if you do not want to exit completely.
Thanks for reading. Please consider this article a first step in your due diligence process. Consulting with a registered and experienced investment advisor is recommended before making any trade.
Read the full article here

