
Introduction
Six Flags (NYSE:SIX) and Cedar Fair (FUN), among the largest global theme park operators, collectively manage 27 amusement parks, 15 water parks, 9 hotels, and more. In March, I endorsed SIX with a Buy rating at $24.87. Since then, the stock has fluctuated between $28.74 and $18.30, and is presently trading around $24.65 post the market’s reaction to the merger announcement with FUN. This analysis delves into the financial status and performance of both companies, examining how the merger will affect the valuation on each company, and which company investors should purchase to capitalize of this merger event.
The Merger
On November 2, 2023, Six Flags and Cedar Fair made the decision to merge, outlining the transaction’s details and the advantages it presents. Following the announcement of the merger, the stock prices of Six Flags and Cedar Fair have climbed from $21.90 and $37.23 at the close on November 1, 2023, to $24.65 and $38.78, reflecting gains of 12.6% and 4.2%, respectively.
The transaction is expected to close in the first half of 2024 following Six Flags shareholders’ approval and regulatory clearance. As the precise date remains unspecified, the exact timing of the merger is unknown. However, based on the provided timeline, we have a period from now until the first half of the next year to evaluate the stock.
Merger and acquisition offers are not uncommon in this industry. In 2019, SIX proposed $70 in cash and stock to acquire FUN, offering a 20% premium. Similarly, in 2022, SEAS put forth an offer of $60 per share to buy FUN, representing approximately a 9% premium over its trading value at the time.
In the theme park realm, where substantial capital investment is necessary, the industry’s strengths can also confine it. Significantly boosting profitability often involves trimming operational expenses through consolidation. Through this merger, the companies anticipate achieving synergies worth $200 million. These synergies will stem from a blend of operational efficiencies (such as reductions in SG&A, taking advantage of economies of scale, etc.) and planned strategic initiatives.
Most market analysts have applauded the merger, hailing it as a beneficial move for both Six Flags and Cedar Fair. Analysts at Citi, B Riley, Jeffries, and others have upgraded their projections in support of this consolidation. Yet, dissenting voices exist. Rosenblatt downgraded their recommendation, while SIX activist investor Land & Buildings voiced opposition to the merger, asserting that their proposed initiative would yield greater value for SIX than the merger. Their prior proposal, a sale-leaseback of SIX’s properties, would effectively split SIX into two entities: 1. a Prop-Co managing properties and leasing them to SIX, and 2. an OpCo running the business. However, their minimal 1% stake in SIX’s outstanding shares renders their vote inconsequential to the merger’s outcome. Other significant shareholders include H partners at 13+%, Blackrock at ~12%, Vanguard at ~10%, and Thunderbird Partners at ~5%. Although this merger doesn’t impede SIX from pursuing the proposed PropCo/OpCo split, current circumstances suggest this might not occur in the near future.
Deep-Dive Assessment
This article excludes consideration of cost savings from post-merger synergies since the post-synergy merger will benefit the merged company and does not present a case for buying one stock or the other. Furthermore, the financial results for 2020 will be omitted due to the significant impact of COVID-19 on both companies during that period.
This article will conduct a comparative analysis of the companies across four key criteria:
-
Revenue trend
-
Company size
-
Operational efficiency & profitability
-
Debt
Subsequently, I’ll evaluate these companies in relation to their merged entity, offering recommendations for investors contemplating a choice between the two for purchase.
Revenue Trend
Over time, Six Flags has consistently generated higher revenues than its counterpart. Both companies have pursued strategies to increase admission prices, albeit to varying extents. As evidenced below, FUN and SIX saw a respective rise of 20% and 33% in admission prices per guest from 2018 to TTM. This deliberate increase in pricing has impacted attendance levels, with FUN experiencing a 6% drop in attendance from 2019 to the present. Six Flags faced a more significant decline, with a 33% reduction in attendance since 2019 due to their strategy of elevating admission prices and reducing the availability of lower-priced all-season passes.
In terms of food and merchandise revenue, SIX outperformed FUN from a unit economics perspective. While Six Flags historically earned slightly more than FUN, this disparity widened from 3% to 18% between 2018 and TTM. Though there might be some variations in classification, the trend remains consistent: Six Flags’ visitors spend more within the park compared to FUN’s visitors.
However, the most significant contrast lies in non-park revenues, encompassing accommodations. Despite potential differences in classifications, these figures illustrate the substantial disparity in non-park revenues between the two companies. With seven hotels and resorts compared to SIX’s two, FUN’s non-park revenue per capita stands at an astonishing 260% higher than SIX. Since 2018, FUN has witnessed a 60% growth in non-park revenues, whereas SIX experienced a decline of 3% during the same period.
Revenue sources per attendance (Company SEC Filings)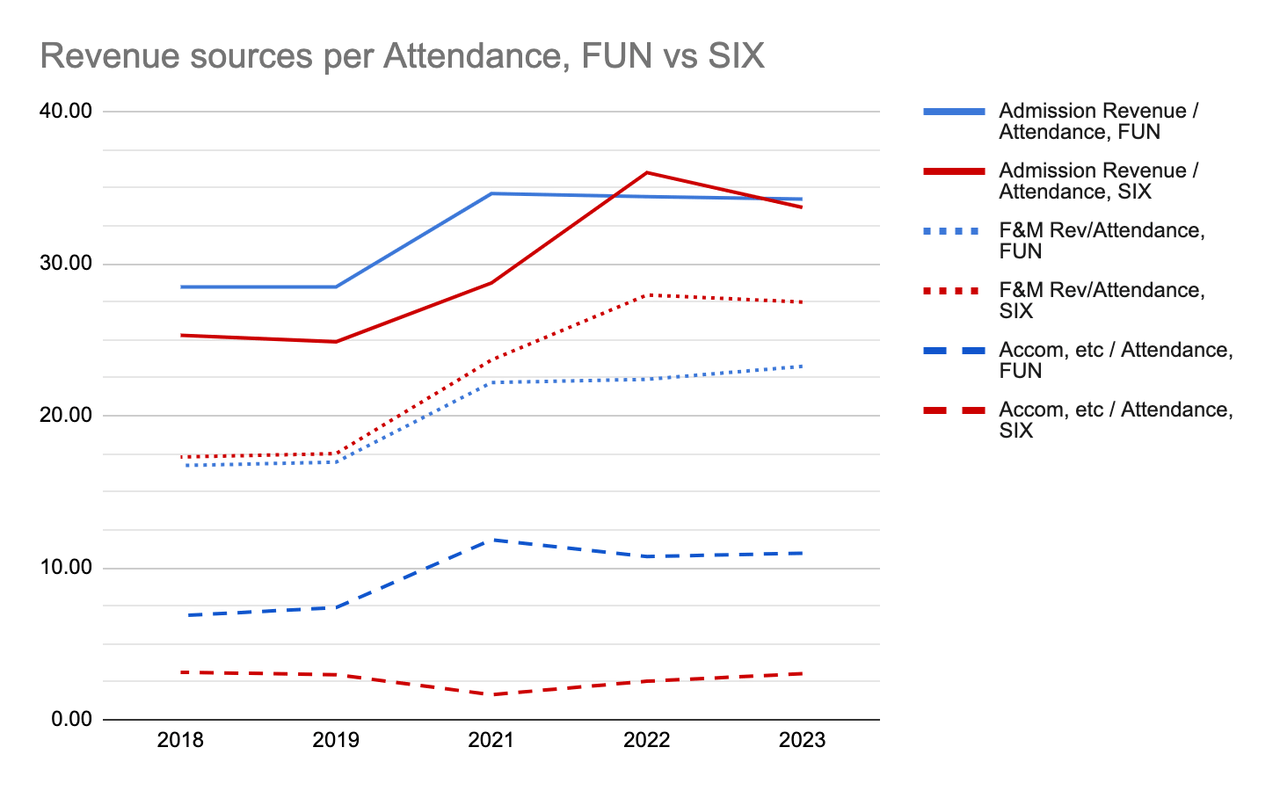
In essence, both companies exhibit a similar per capita spending pattern, but their strategies for enhancing this spending differ significantly. FUN implemented more moderate increases in admission prices and food and merchandise costs, whereas SIX had to resort to significant adjustments using the same tactics to achieve comparable per capita numbers. The critical disparity arises from FUN’s advantage in accommodation availability. With five additional accommodation properties, FUN successfully retained its customer base while SIX experienced a decline in visitors.
FUN and SIX Attendance and Per Capita Spend (Company SEC Filings)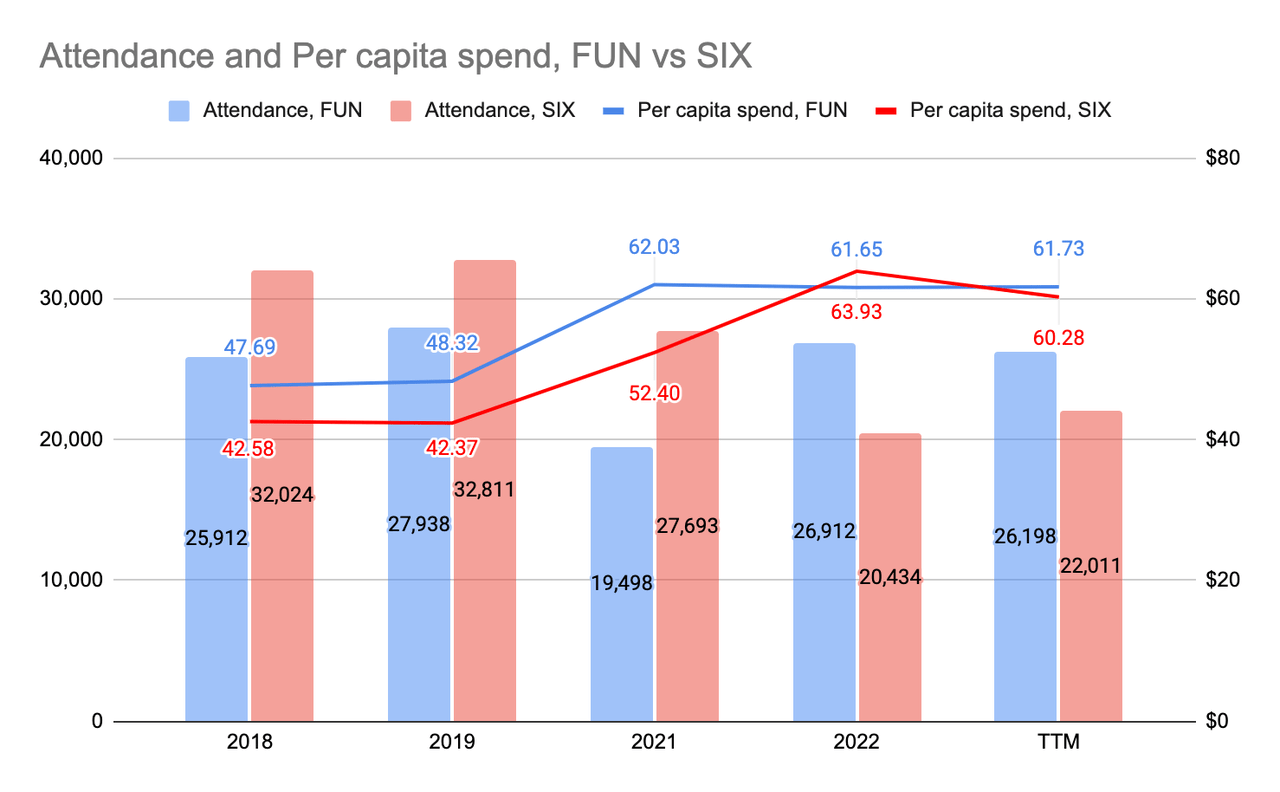
Overall, due to their broader range of options (specifically, more hotels), FUN has experienced revenue growth in recent years, while SIX has faced a decline. While the post-pandemic recovery might have significantly contributed to FUN’s revenue surge in 2022, the company appears capable of maintaining these price levels without adversely impacting attendance. Going by this measure, FUN outperforms SIX.
Revenue, FUN vs SIX (in ‘000s) (Company SEC Filings)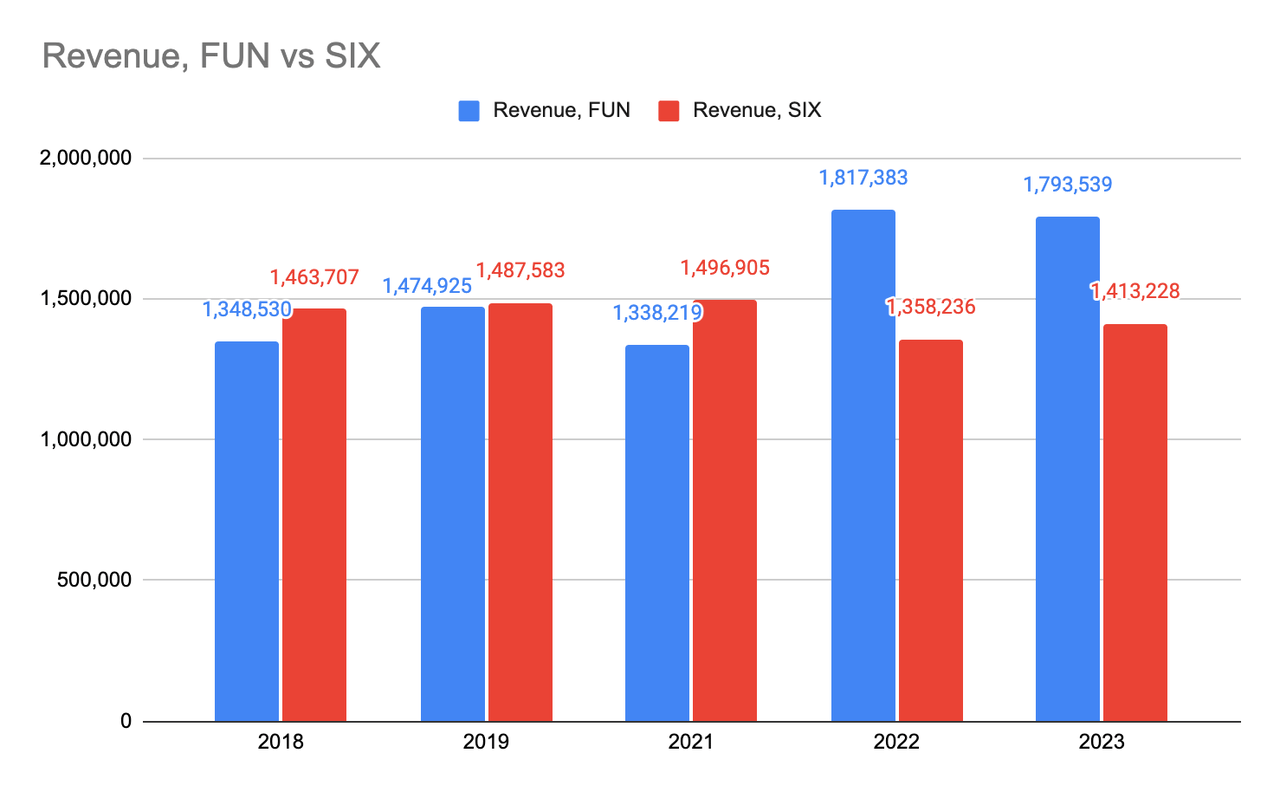
Revenue Trend: FUN outperforms SIX.
Company Size
Let’s shift our focus to the company size aspect. As per the merger presentation, FUN stockholders will receive a 1:1 ratio on their stock for the surviving company, whereas SIX stockholders will receive a 0.58:1 ratio. The resulting combined entity will comprise 51.2% from FUN and 48.8% from SIX. Additionally, SIX stockholders are slated to receive a special dividend of $1 per share.
| As of 3Q 2023 | FUN | SIX |
| Shares outstanding | 51,017 | 83,541 |
| Stock Price (Dec 15, 2023) | 38.78 | 24.65 |
| Market Capitalization | 1,978,439 | 2,059,282 |
| Less: Total Debt | 2,272,961 | 2,273,362 |
| Add: Cash | 134,394 | 66,763 |
| Enterprise Value | 4,117,006 | 4,265,881 |
| Combined EV | 8,382,887 |
Values other than stock price in (‘000s).
As of Friday, December 8, 2023, it’s evident that SIX’s enterprise value surpasses FUN’s. Specifically, SIX represents 51.1% of the combined enterprise value, while FUN holds the remaining 48.9%-a near complete flip from the initial merger presentation. While future stock price fluctuations could alter this scenario, the current trend indicates that SIX stockholders might find themselves at a disadvantage in this particular aspect.
Company Size: FUN benefits from this merger.
Operating efficiency & profitability
Firstly, in terms of EBIT, SIX consistently outperformed FUN both in total dollar value and margins. Despite FUN’s outperformance over SIX in 2022, this appears to have been a singular occurrence, as FUN’s trailing twelve months TTM performance has reverted to underperforming compared to SIX.
EBIT in dollar values and percentage of revenue (in ‘000s) (Company SEC Filings)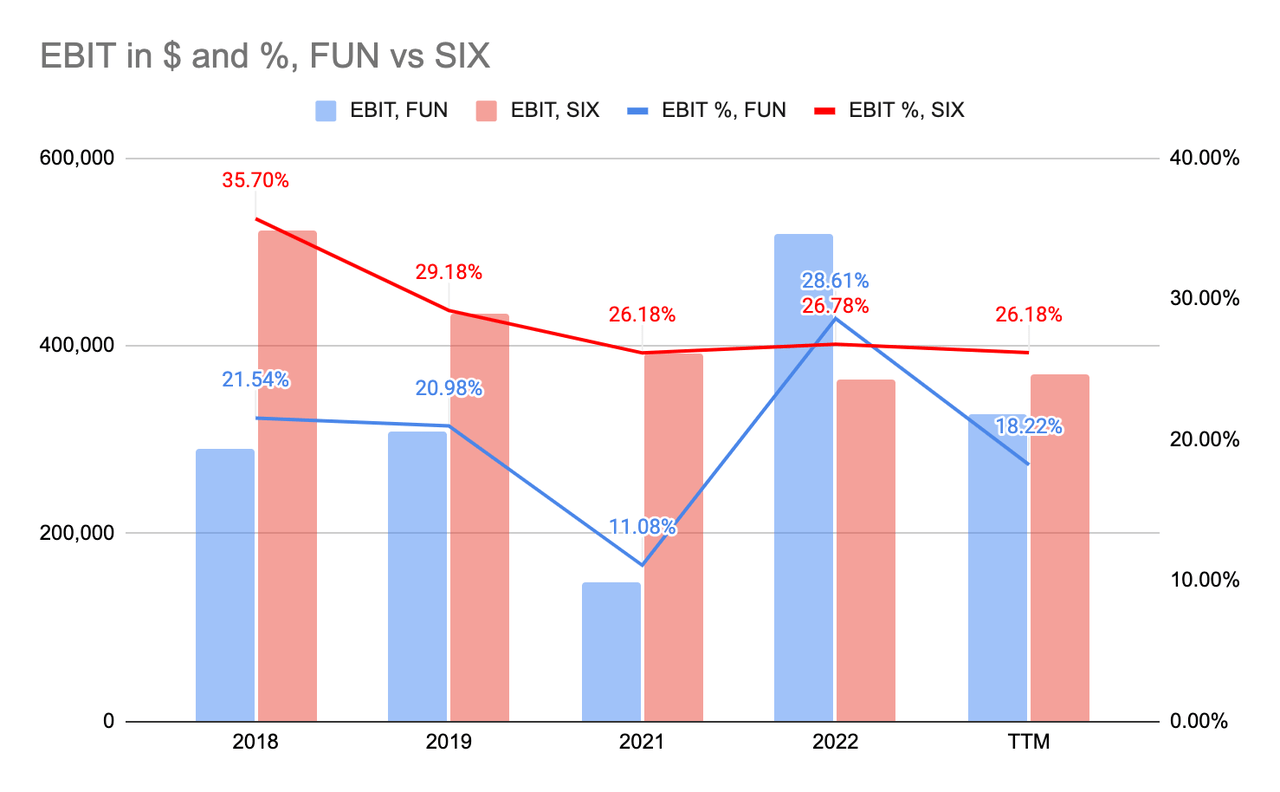
Secondly, in SG&A, SIX demonstrates superior performance over FUN in both dollar values and revenue metrics. Notably, up until 2021, Six Flags boasted higher attendance than FUN, indicating that the disparity in SG&A costs isn’t driven solely by the number of visitors in each company but rather points to inefficiencies within FUN.
SG&A in $ (‘000s) and % of Revenue, FUN and SIX (Company SEC Filings)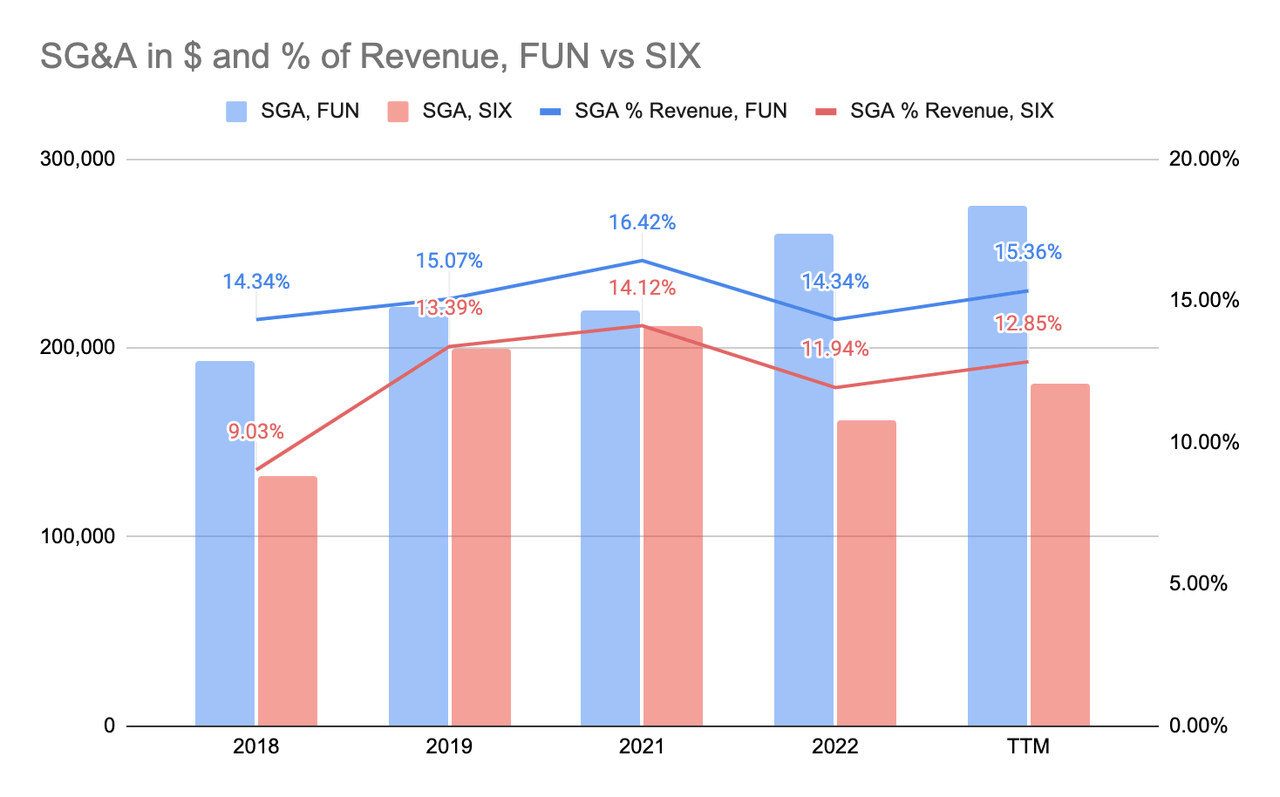
Lastly, examining the companies’ unlevered free cash flow, I focused on what Bruce Greenwald terms ‘maintenance capex’, which refers to the capital expenditure necessary to maintain the same operational level as the previous term. By excluding depreciation, amortization, and capital expenditure, SIX showcases slightly lower unlevered free cash flow than FUN, but it does so with greater efficiency.
|
TTM, 3Q23 |
FUN |
SIX |
|
EBIT |
326,788 |
369,989 |
|
Less: Tax |
42,861 |
35,228 |
|
Less: Chg in WC |
-23,776 |
30,524 |
|
UFCF |
307,703 |
304,237 |
|
UFCF % Rev |
17.16% |
21.53% |
Summing up these operating metrics leads to a consistent conclusion: SIX demonstrates greater efficiency and generates higher cash flow for the company. This underscores the advantage held by SIX in these operational aspects.
Operating efficiency & profitability: Six Flags is a better operator.
Debt
Moving to the aspect of the companies’ debt, it’s evident that both carry substantial debt burdens. This aligns with expectations in the theme park industry, known for requiring significant capital for inception, maintenance, ride construction, and various acquisitions over the years. Notably, FUN acquired Schlitterbahn for $261 million and California’s Great America (land only) for $150 million in 2019. While the latter was later sold for $310 million, the proceeds were primarily allocated towards share repurchases ($185 million in 2022), dividend distributions ($33 million in 2022), and a portion of its term notes (part of $264 million). A similar pattern emerges with Six Flags. Pre-Selim Bassoul’s tenure as CEO, Six Flags accumulated debt to cater to shareholder demands through share repurchases and dividends. For an in-depth exploration of this, please refer to “Capital Allocation” in my prior article on SIX cited above.
The truth about debt is that it tends to persist, evolving into new debt rather than being entirely repaid. In a stable interest rate environment, this dynamic serves the interests of both lenders and debtors. Lenders benefit by retaining their capital invested in companies fulfilling their obligations, avoiding the need to seek new clients. For debtors, it means continually managing interest payments rather than eliminating the principal debt.
FUN and SIX Net Debt (2018 – Present) (Company SEC Filings)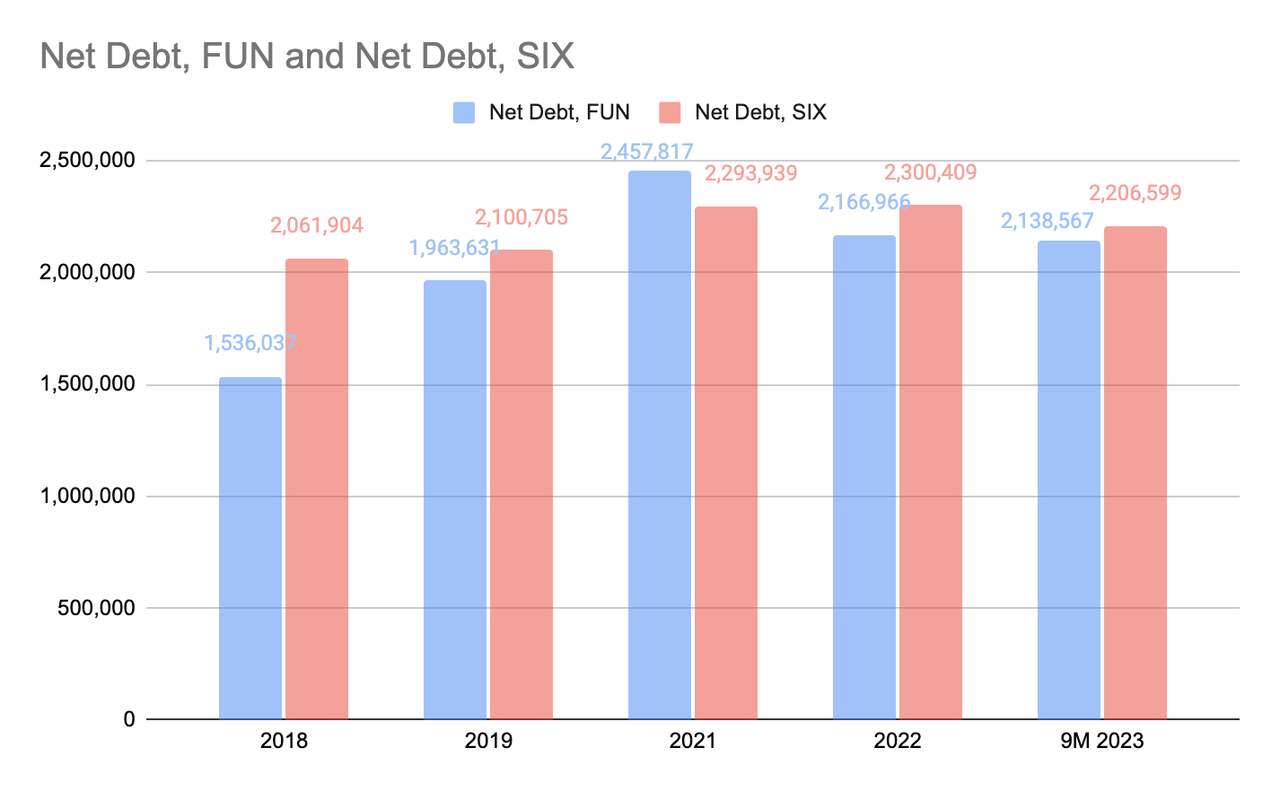
However, as interest rates climb, securing new debt comes at higher costs. This trend has already unfolded within SIX, where they’ve refinanced old debt into new obligations at elevated interest rates. For instance, their previous $1 billion, 4.875% 2024 Notes have shifted to $800 million, 7.25% 2031 Notes. While this isn’t entirely the fault of the current management, it poses a shared challenge for both companies if interest rates continue to soar. Despite some narrowing of the gap, Six Flags still maintains more debt than its counterpart. Moreover, owing to the new notes and prevailing interest rates, SIX’s capacity to manage its debt is comparatively weaker than FUN.
| FUN | SIX | |
| Annual Interest (in ‘000s) | 127,625 | 153,757 |
| Times Interest Earned | 2.56 | 2.41 |
| Net Debt to EBITDA, TTM | 4.44 | 4.38 |
| Net Debt to UFCF, TTM | 6.95 | 7.25 |
Source: Company SEC filings, author calculations.
Both companies have taken measures to alleviate their debt burdens. FUN’s sale of land, as mentioned earlier, and SIX’s decision to halt its share repurchase program and dividend distributions illustrate their focus on debt management. Presently, FUN exhibits stronger debt levels and a better capability to service its obligations than SIX.
Debt: FUN has less debt and better debt servicing capacity.
The X Factor
Up until now, the scales seem evenly balanced. Six Flags gains from merging with FUN, a rival boasting higher revenue and superior debt handling capabilities. On the other side, FUN secures a majority stake despite being the smaller and less operationally efficient entity in this merger. Both sides stand to gain.
However, a pivotal difference between the two companies tilts the balance: non-controlling interests. If you delve into Six Flags’ SEC filings, you’ll notice a line in their income statement:
SIX Non-Controlling Interest Obligations (SEC Filings)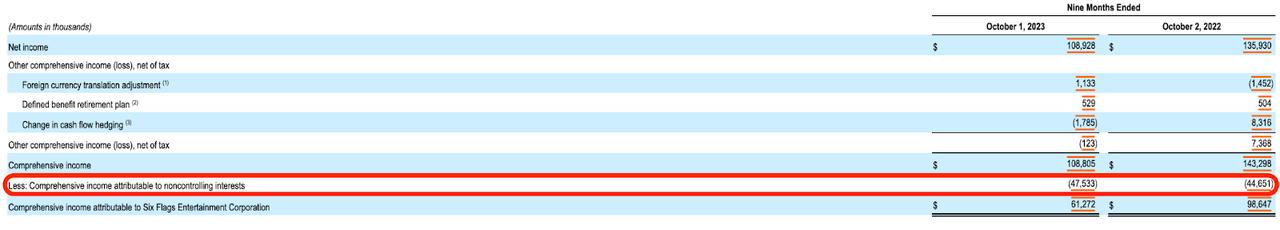
And this segment:
SIX Non-controlling interests (Company SEC Filings)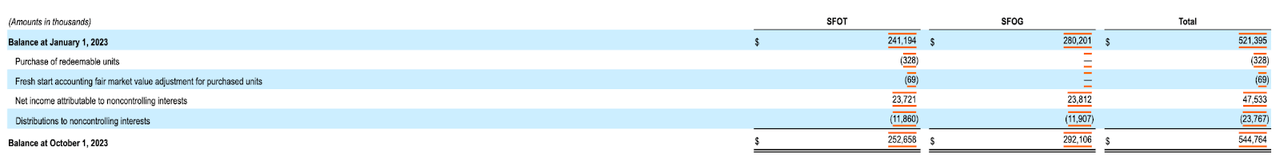
These entries arise because Six Flags doesn’t wholly own two of its parks: Six Flags over Texas (SFOT) and Six Flags over Georgia (SFOG). These parks belong to limited partnerships, where Six Flags has steadily acquired interest over time. For a brief history, you can refer to this page. As of the third quarter of 2023, SIX owns 31.5% of SFOT and 54.1% of SFOG. The remaining limited partnership shares are estimated at $253 million and $292 million, totaling $545 million.
The interest obligations amount to $47.5 million in 2023 and will persist until 2027 and 2028 for SFOG and SFOT respectively. Additionally, the interest obligation value will increase based on a cost-of-living adjustment, reflective of SSA’s rates. Moreover, limited partners have the option to tender their stake, which Six Flags would need to compensate. The future scenario in 2027 and 2028 remains uncertain, whether the current limited partnership will be required to fully tender their stakes or if this arrangement will endure.
In terms of scale, this distribution amounts to over a third of capex spending, 30% of cash interest, and nearly 1/8th of the company’s EBIT in 2022. Through merging with FUN, Six Flags secures a significant advantage, as they can distribute this responsibility within the merged entity rather than handling it independently.
Valuation
Given the information at hand, we’ll proceed to partition the companies according to their ownership within the overall entity. To incorporate the influence of interest obligations within SIX, I’ll deduct this amount from the EBIT and UFCF levels. However, FUN’s performance remains unaffected as there’s no corresponding line item for this in FUN’s financials.
| FUN | SIX | Combined | |
| Current EV (in ‘000s) | 4,117,006 | 4,265,881 | 8,382,887 |
| Revenue (in ‘000s) | 1,793,539 | 1,413,228 | 3,206,767 |
| EV / Revenue | 2.30 | 3.02 | 2.61 |
| UFCF (in ‘000s) | 307,703 | 256,737 | 564,440 |
| EV / UFCF | 13.38 | 16.62 | 14.85 |
| EBIT (in ‘000s) | 326,788 | 322,489 | 649,277 |
| EV / EBIT | 12.60 | 13.23 | 12.91 |
| Net Debt (in ‘000s) | 2,138,567 | 2,206,599 | 4,345,166 |
| Net Debt / EBIT | 6.54 | 6.84 | 6.69 |
| Annual Interest (in ‘000s) | 127,625 | 153,757 | 281,382 |
| Times Interest Coverage | 2.56 | 2.10 | 2.31 |
Source: Company SEC Filings, Author calculation
Upon examining the consolidated financial reports of both companies, it becomes evident that the primary advantage predominantly favors SIX holders. Across various metrics encompassing company valuation, debt burden, and debt management, Six Flags demonstrated notable enhancements in their figures in comparison to the merged entity. Conversely, Cedar Fair appears not to have derived any discernible advantage from the merger itself. Investors interested in purchasing stock resulting from the merger should take action before the merger concludes in the first half of 2024.
Risks
1. High debt load: Both companies carry substantial levels of debt, necessitating timely refinancing. Should prevailing high interest rates persist, the existing debt could pose a significant challenge to the financial well-being of the companies.
2. Past performance ≠ future performance. Although the evaluations based on the companies’ historical performance are informative, they do not guarantee similar results in the future. Substantial variations in the future performance of the companies may occur, leading to alterations in their respective valuations.
3. The merger is not guaranteed: Shareholders Land & Buildings (1% owners of SIX) have raised objections, and Neuberger Berman (3% owners of FUN) has expressed concerns. Particularly noteworthy is Neuberger Berman’s previous involvement in a group of investors that opposed FUN’s acquisition by the Private Equity firm Apollo Management Group in 2010. Additionally, regulatory approvals are not guaranteed, presenting potential risks that could lead to an unsuccessful merger.
Conclusion
At first glance, the merger offers advantages to both parties, a fact that holds true. The combined entity can leverage cost synergies and enhanced economies of scale, leading to increased profitability. For Six Flags, merging with a company boasting high revenues and a stronger debt-servicing capacity is advantageous. Meanwhile, Cedar Fair gains a majority stake despite being valued less, benefiting from the improved operational efficiency of the merged entity.
However, when looking at the bigger picture, I believe one side gains more. Despite both companies generating similar levels of free cash flow, Six Flags has been obligated to allocate a significant sum to its non-controlling stakeholders annually. Through merging with Cedar Fair, they’ll share this obligation, reaping the benefits of this shared responsibility. As the merger discussions near conclusion, it appears that SIX holders emerge as the bigger beneficiaries in this arrangement.
Read the full article here

