
SPY ETF has become very expensive
My goals for this article are twofold. First, I want to examine how expensive the market has become, as represented by the SPDR S&P 500 Trust ETF (NYSEARCA:SPY). I will examine the valuation beyond the high P/E or low yield often discussed and explain why the current valuation is so concerning and led to my decision to trim my exposure. Second, I want to discuss the alternative ideas and what I did with the proceeds.
Before diving into more specifics SPY, I also want to point out that the analyses and conclusions are applicable to other broader market index funds such as the Vanguard S&P 500 ETF (VOO), iShares Core S&P 500 ETF (IVV), Vanguard Total Stock Market Index Fund ETF Shares (VTI), etc. All these funds follow very similar (or identify indexing methods) and are highly correlated. The main differences are their fees and tradability in my view. As you can see from the chart below, SPY features the highest trading volume (which tends to enhance liquidity and narrow trading spread). Among the three funds listed there, SPY has the highest average daily dollar volume at $32.82 billion, more than 10x higher than VOO at $2.59 billion and IVV at $2.72 billion, while its AUM is only about ½ of VOO and comparable to VTI. As a price for such tradability, investors pay a higher fee for SPY (0.09%, compared to VOO and VTI’s 0.03%).
Seeking Alpha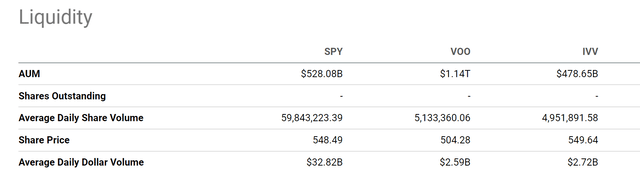
SPY ETF: PE, dividend yield, and PEG ratio
Let me first quickly recap the usual valuation metrics in case there are readers unfamiliar with the background. The fund trades at an FY1 P/E of 22.75x, although this is under the assumption of a double-digit EPS growth rate (the projected EPS growth rate is 16.2% in the next few years, as seen from the chart below). Under a TTM basis, the P/E is a much higher 28.5x, as seen in the second chart below.
SPY fund description Source: www.multpl.com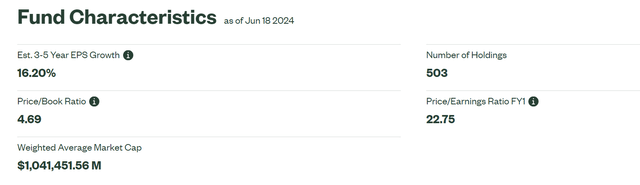
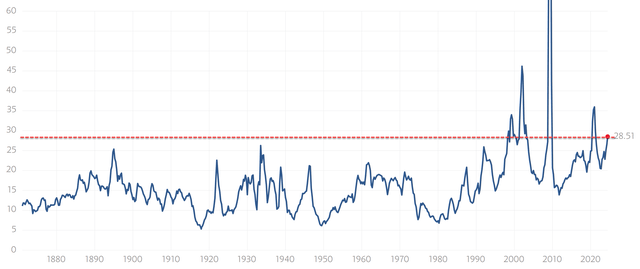
I am very skeptical of the projected double-digit EPS growth rates. As you can see from the chart below, SPY (and its similar peers too) have been growing their dividends in the past 3~5 years at an annual rate in a range of about 5~8%. For an index fund, I consider the dividends a reliable reflection of the true economic earnings of its collective holdings. Consequently, I consider the dividend growth a good indicator of their true growth. At a P/E of 28x and a growth rate of 5~8% in recent years, the PEG ratio for the fund is in the range of 3.5x to 5.6x, far above the ideal 1x threshold most growth investors look for.
Also, note that the dividend yields also point to substantial overvaluation. As seen in the chart below, the TTM dividend yield of SPY is currently 1.23%, about 16% lower than its 4-year average yield of 1.46%, indicating an overvaluation by about 16%. Other peer funds’ data confirm the same trend. For example, VOO has a TTM dividend yield of 1.27%, which is also about 16% lower compared to its 4-year average yield of 1.50%. Although VTI shows a noticeably higher yield as a percentage of its 4-year average yield, indicating the least degree of overvaluation, a point I will revisit in the last section.
Seeking Alpha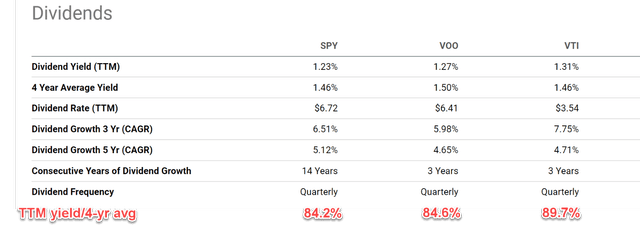
SPY ETF: the excess CAPE yield
SPY’s overvaluation becomes truly alarming in my view when we benchmark it by risk-free rates. There are many ways to do this, and a simple way is to examine the spread between SPY’s dividend yield and 10-year treasury rates. Here, I will use the excess CAPE Yield (“ECY”) promoted by Nobel Prize winner, Dr. Robert Shiller. The chart below shows the ECY (defined as the CAPE yield of SP500 minus the real 10-year treasury rates). Details of the data can be found on Dr. Robert Shiller’s website, and I will just quote the key takeaway here:
There is a clear correlation between the ECY and the subsequent return of the SP500. The reason behind this is very simple. A low ECY indicates that the S&P 500 is trading at a high valuation relative to risk-free rates (i.e., the real 10-year treasury rates). Thus, I would expect a lower odd for the S&P 500 to outperform treasury rates and vice versa. The ECY currently hovers around 1.2% as seen, among the lowest level historically. The last occurrences of such low ECY date back to the conditions before the dot.com bubble and 2008 crises. In both cases, the excessive return over treasury bonds in the next 10 years was either negative or near zero per annum.
I don’t expect this time to be different, with SPY trading at such a premium valuation and 10-year treasury rates hovering near 4.5%. And I will detail my specific allocation decisions next.
Shiller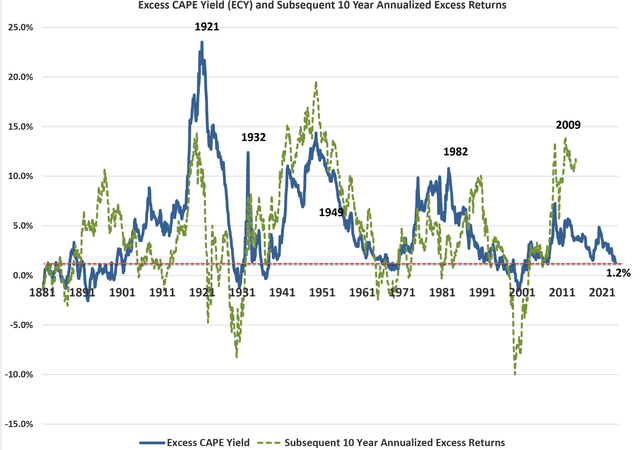
Other risks and final thoughts
It won’t be a useful article if I only point out the problem without A) analyzing the upside risks, and/or B) suggesting solutions. The main upside risk to SPY is the soft-landing scenario in my view. In this scenario (this elusive scenario, I may add), rates would GRADUALLY decrease so that the CAPE ECY gradually widens without any drastic correction to the equity valuation. But in this case, bonds would enjoy a robust rally too. Thus, the excess return from SPY might still be limited (if at all). Moreover, the odds of a soft landing might be lower than expected. For example, JPMorgan CEO Jamie Dimon recently shared his following thoughts on the soft landing:
… markets are pricing the chance of a soft landing, i.e., modest growth along with declining inflation and interest rates, between 70% and 80%. I believe the odds are a lot lower than that.
Finally, alternative ideas. In accounts where we have the choice to buy funds other than those based on SP500, we are completely avoiding SPY (or equivalent funds such as VOO). You can see an example in the chart below. We use VTI (for its lower fees and lower degree of overvaluation, as aforementioned) and VEU (for overseas exposure) as part of our core holdings. We also hold sizable positions in treasury bonds (VGIT and EDV) due to the unfavorable outlook of excess return from SPY discussed above.
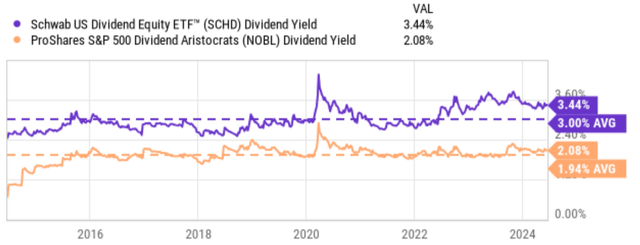
Finally, the overvaluation in the equity market is not evenly distributed. Some segments are more so (like tech) and some segments are less so. Notably, the value sector may even be at a discount. As two specific examples, the last chart shows the dividend yield of Schwab U.S. Dividend Equity ETF (SCHD) and ProShares S&P 500 Dividend Aristocrats ETF. These funds are good representatives of value stocks in my mind. And as you can see from the chart, their current yields are noticeably above their long-term historical mean, implying an undervaluation. This is also the reason that our tactical holdings are primarily value stocks.
Author Seeking Alpha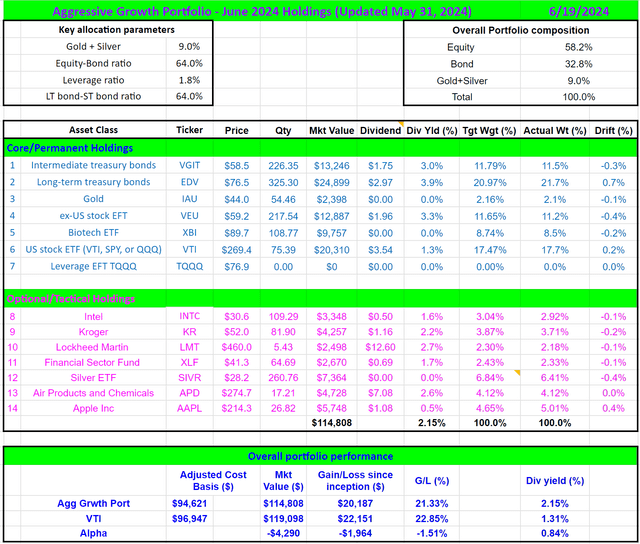
Read the full article here

