
Energy stocks, both oil & gas-related and those in clean tech/energy, have struggled this year. While the XLE ETF is the worst-performing of the 11 S&P sector funds, the Invesco Solar ETF (NYSEARCA:TAN) is down more than 4%, including dividends, in 2023 (although it is now marginally positive on the year following Friday’s 6% advance). That is a steep underperformance compared to the S&P 500’s robust gain year to date.
I reiterate my sell rating on TAN based on poor momentum despite some favorable seasonal trends and a reasonable valuation.
YTD ETF Performance Heat Map
Finviz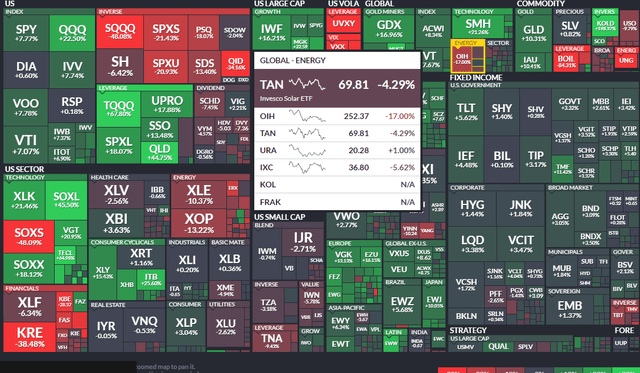
According to the issuer, TAN is based on the MAC Global Solar Energy Index and the ETF will invest at least 90% of its total assets in the securities, American depositary receipts (ADRs) and global depositary receipts (GDRs) that make up the index, which is comprised of companies in the solar energy industry. TAN and the Index are rebalanced quarterly.
The solar industry got a boost on Friday as shares of First Solar (FSLR) jumped nearly 25% on the news that it had acquired a small European leader in perovskite technology for $38 million. I suspect there is something else going on here – M&A of that size usually does not have such an outsized impact on the acquirer. Be on the lookout for more news with First Solar in the coming days.
The ETF features a somewhat high 0.69% annual total expense ratio and has $2.1 billion in assets under management. With 53 total positions, the median 30-day bid/ask spread is 11 basis points, so using limit orders during less liquid periods of the trading day is prudent. The average market cap of the ETF’s holdings is just $9.2 billion while its forward price-to-earnings ratio, according to Invesco, is just 16.3 – that’s below the S&P 500 forward P/E which is near 18.
Digging into the portfolio, Morningstar’s Style Box illustrates that TAN is a growth-oriented small and mid-cap fund. On the factor spectrum, the yield is relatively low while momentum is high. Earnings quality is in the middle of the pack while investors should brace for elevated volatility when holding this product.
TAN: Portfolio & Factor Profile
Morningstar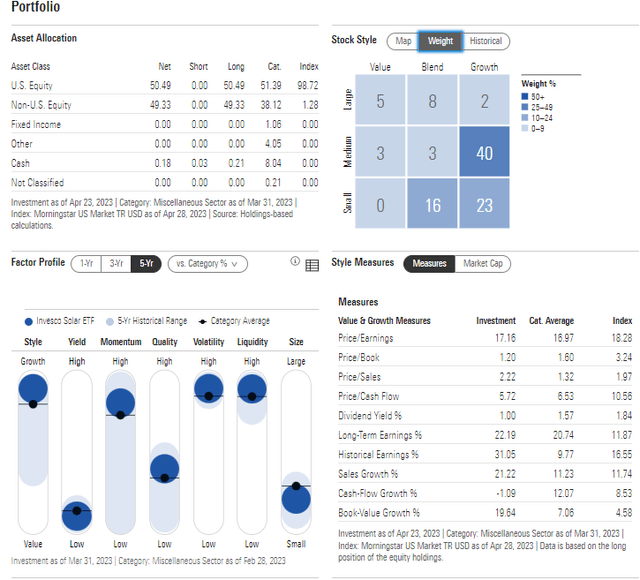
TAN has a sizable weight in the Information Technology sector, but it usually trades more closely with the Energy sector. Higher oil and gas prices typically make renewable energy more attractive. Investors also get international diversification through the ETF as less than half the portfolio is comprised of domestic companies.
TAN: Portfolio Allocations
Invesco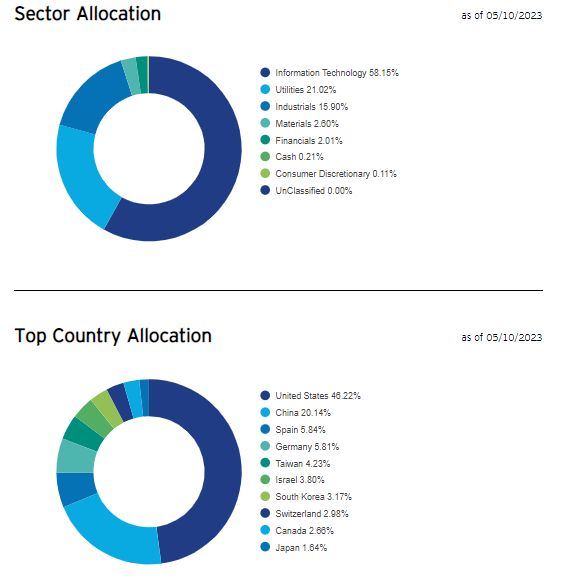
Seasonally, TAN tends to rally from late March through year-end with little in the way of let up during that span, according to data from Equity Clock. This is a bullish factor to consider when deciding on going over or underweight the space.
TAN: Bullish Seasonal Trends In Q2
Equity Clock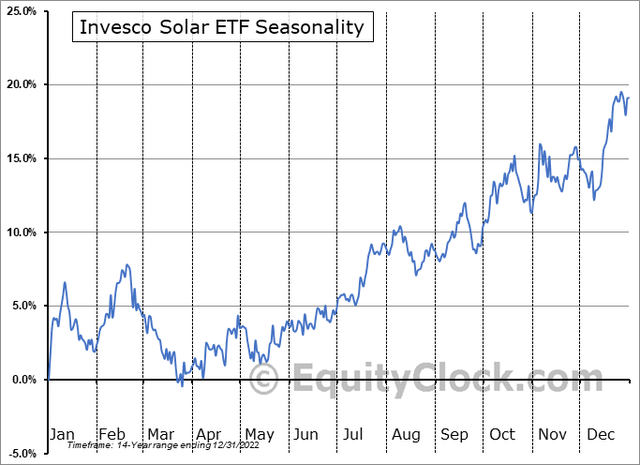
The Technical Take
TAN is threatening to breach its uptrend support line dating back to May of last year when it notched a bullish double bottom pattern compared to the February 2022 low. After many months of consolidation on declining volume, the presumption is that the TAN chart should resolve in the broader trend – which is down off the high in early 2021. Still, we have not yet seen a breakdown in the RSI momentum gauge at the top of the chart.
To help confirm a move lower, bears would like to see the RSI print fresh lows. This is something to monitor, but it is not an imminent sell signal. I still see the fund heading lower from here technically, and getting long in the mid-$50s with a stop under that would be a more favorable risk/reward play. On the upside, a rally above the flat 200-day moving average as well as the $83 to $85 range would suggest a bullish breakout from this symmetrical triangle consolidation pattern.
TAN: Bearish Consolidation Pattern Ongoing
Stockcharts.com Stockcharts.com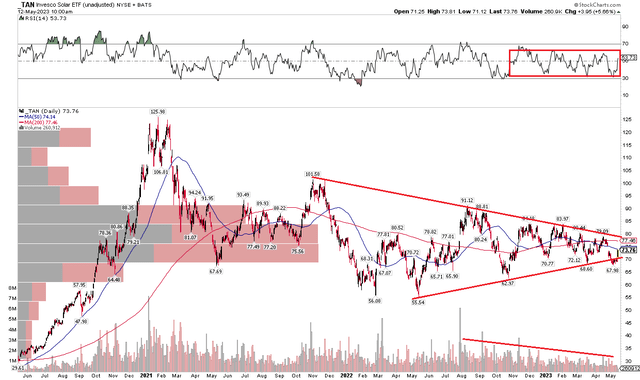
The Bottom Line
Despite the 6% rally in TAN on Friday, I reiterate my sell rating. Amid weaker energy prices and a weak technical setup, I see shares moving lower in the months ahead.
Read the full article here

