
As good as it gets?
The U.S. stock market has been in rally mode dating back to last October. This includes an impressive bounce since mid-March in the wake of the collapse of a handful of major U.S. banking institutions. The stock market resilience has indeed been impressive. But despite these various positives, the path of least resistance for U.S. stocks as we make our way into the summer is to the downside.
Hanging on the ceiling
The first indication to suggest that U.S. stocks may take a turn to the downside in the coming weeks is stubborn technical resistance. While the S&P 500 surged in the immediate aftermath of the banking crisis in March, the index was stopped in its tracks once reaching its 400-day moving average resistance (pink line in chart below) in mid-April. Since that time, the S&P 500 has grinded back and forth along this resistance level but has been unable to successfully break out to date. The index does have support at its 50-day moving average (blue line in chart below), but these two moving average levels are quickly converging, thus requiring an outcome either to the upside (breakout) or downside (breakdown). The odds are increasingly supporting a downside break to date.
StockCharts.com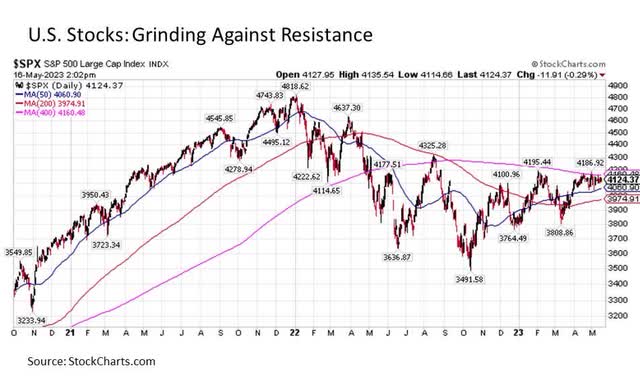
Size matters
So why breakdown instead of breakout for the S&P 500? Part of the answer comes from its mid-cap and small cap stock market counterparts.
Regarding U.S. mid-caps, they have been fading for some time now. In stark contrast to the S&P 500 that continues to trade effectively at its February peaks, the S&P 400 Mid-Cap Index peaked decisively at the start of February and has been fading ever since. Overall, mid-caps are now nearly -12% below their peaks from earlier this year. In the process, the S&P 400 Mid Cap is well below its 400-day moving average and is being steadily pushed lower at its downward sloping 50-day moving average.
StockCharts.com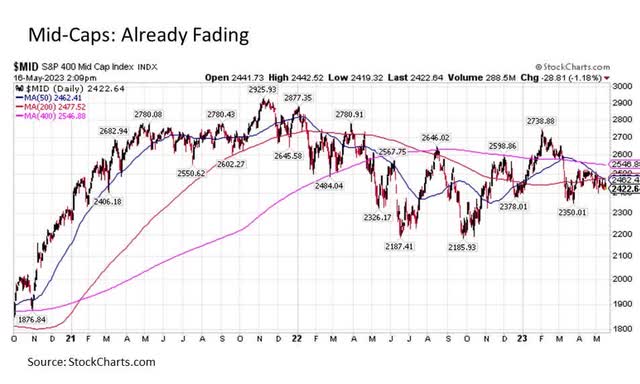
As for small caps, the story is even less encouraging. Not only is the S&P 600 Small Cap Index more than -15% below its February highs and below its main moving average resistance levels, but it appears on track to re-enter bear market territory and at minimum retest previous lows from 2022.
StockCharts.com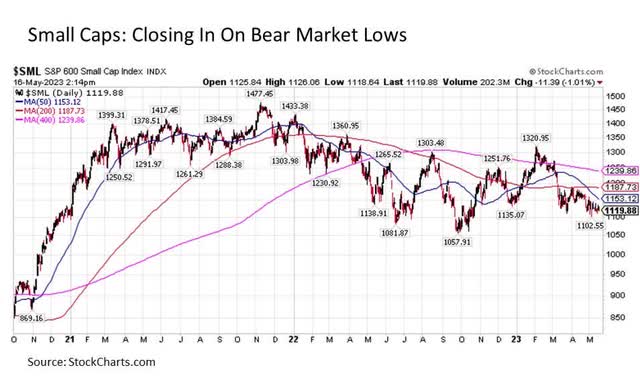
Why does the relatively poor performance of mid-caps and small caps matter? Because these smaller segments of the market have historically led U.S. large caps in either direction. Thus, it would be highly unusual for U.S. large cap stocks to rally from here while U.S. mid-caps and U.S. small caps continue to move in the opposite direction.
Wrong said Fed
Another implied short-term downside signal for the U.S. stock market is expectations around interest rates from the U.S. Federal Reserve. When the Fed raised interest rates by 25 bps to the 5.00% to 5.25% range coming out of their latest May 2-3 meeting, they gave hints that this might be their last rate hike in the current cycle. And the fact that the Fed funds futures market is currently signaling a more than 75% probability that the Fed will keep rates unchanged at their next meeting on June 14 is a confirmation signal in this regard. But it is what comes after June that is sending a troubling short-term signal for U.S. stocks.
In July, the futures market is assigning a nearly 30% chance for a Fed rate cut coming out of their July 25-26 meeting. By September 19-20, the odds for at least a quarter point Fed rate cut jump to nearly 60%. And two meetings later on December 12-13, markets are currently pricing in a more than 98% of at least one quarter point rate cut and a two-in-five chance for as many as three 25 bps rate cuts.
This is a lot of anticipated monetary easing in an environment where the core CPI inflation rate is still stubbornly above 5% and falling slowly. In other words, it will likely take a lot for the Fed to suddenly turn and start cutting rates so quickly after still raising rates. This is particularly true given the important lessons the Fed learned from three successive monetary policy missteps in the 1970s when it started cutting interest rates far too soon before the inflation problem was completely eradicated. Much like a patient that quits a course of antibiotics too soon, the inflation problem came back even worse three consecutive times before the Fed finally learned that they need to keep short-term interest rates high long after the inflation rate is falling below the Fed funds rate (inflation is currently still above the Fed funds rate today) before it could declare mission accomplished on the inflation front.
What does this imply for today? The Fed is likely to keep short-term interest rates higher for longer beyond what the Fed funds futures market is currently pricing in all else equal. This is likely to be true even if inflation continues to fall back down toward its 2% target. And this is likely to be true even if the economy eventually falls into recession, which it officially has not to date.
So what then would justify current Fed funds futures expectations for a 25 bps rate cut as soon as July and as many as three quarter point cuts by December? Just a few of many possibilities: a dramatic slowdown in economic activity and/or unexpected systemic shock event to the financial system and/or a major stock market decline. In other words, in order for the Fed to start cutting interest rates as soon as July or as much by December, we would likely need to see a fairly sizable disinflationary / deflationary downside jolt to the economy and the stock market to justify the move.
Remain disciplined and seek upward paths of least resistance
Current conditions may suggest challenges for the headline S&P 500 Index in the coming months, but this does not mean that capital markets are still not filled with upside opportunities. Just because the overall U.S. stock market may come under pressure going forward does not mean that selected segments within the U.S. stock market cannot perform impressively well. We saw this with selected consumer staples and health care segments throughout 2022. And it is also important to remember that the challenge for one asset class can represent potential opportunity for another. For example, the potentially uncertain economic and market environment described above is historically highly favorable for long-term U.S. Treasuries and gold just to name a few.
Read the full article here

