The US housing market is in the middle of its 6th major downturn since the late 1960s.
Home prices are declining in 75% of major cities, with many areas posting declines for six or seven consecutive months.
In this article, we’ll look at the distribution of home price declines and show where home prices have fallen the most and where home prices have held up the best.
We’ll also compare the depth and duration of this home price downturn to declines of the past to see how it stacks up.
Are Home Prices Declining In My City?
The most time-tested and reliable measure of home prices is the Case-Shiller Home Price Index. The Case-Shiller Home Price Index tells us that home prices at the national level have started to decline, with a peak in the summer of 2022.
Case-Shiller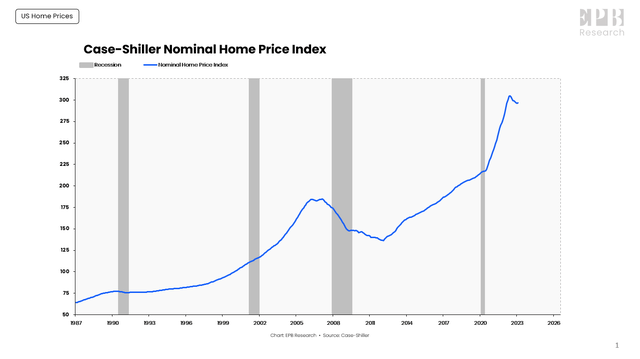
Home prices don’t normally decline in nominal terms. Later in the article, we’ll look at real or inflation-adjusted home prices, which is a much better method for comparing home prices across history.
This chart shows that in the last 30 years, nominal home prices have only declined three times. There was a 2% decline in the 1990 recession and a nearly 30% decline around the 2008 recession. Home prices didn’t drop at all in the 2001 recession.
Case-Shiller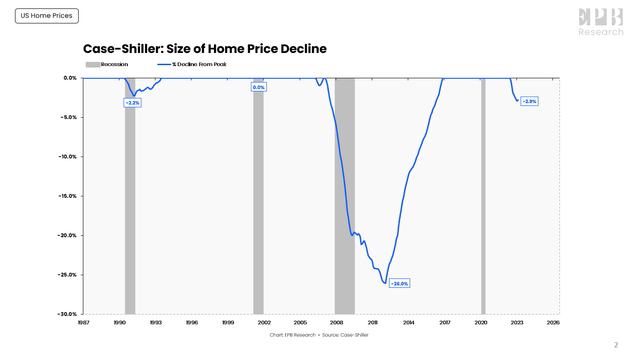
Home prices have declined about 3% nationally from the peak in the summer of 2022, but as we know, real estate is regional. So some areas have declined more than 3%, and some areas are still closer to their peak levels.
In addition to the magnitude or the depth of the home price decline, another way to measure the correction is based on time or “how long has the correction lasted?”
After the 1990 recession, even though home prices only fell by about 2%, it took 37 months for home prices to make a new peak.
The 2000 recession didn’t see any decline in home prices, but the 2008 recession saw home prices crash 30%, and it took 116 months to reach a new peak.
Case-Shiller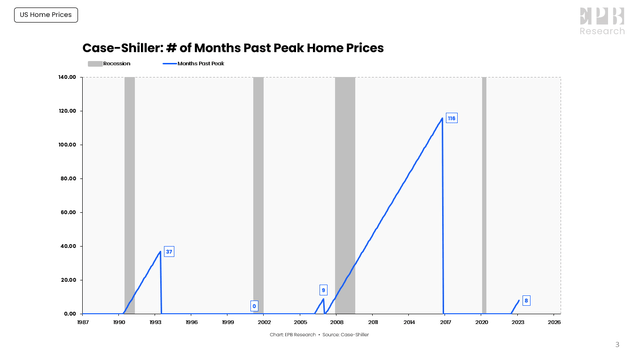
Today, home prices peaked about eight months ago. This data is slightly delayed, so this number is really closer to 10 or 11 months, but the declines are still mild on a national average in terms of magnitude.
The Case-Shiller data publishes home prices for 20 major cities so we can measure how many cities are showing negative home price growth on a rolling six-month basis.
In the 1990 recession, even though home prices only declined about 2% on average, the declines lasted for 37 months and impacted 74% of cities.
The 2008 recession was very large in terms of magnitude, falling 30%, it was very long in terms of duration, taking 116 months to make a new peak, and it impacted 100% of cities.
Case-Shiller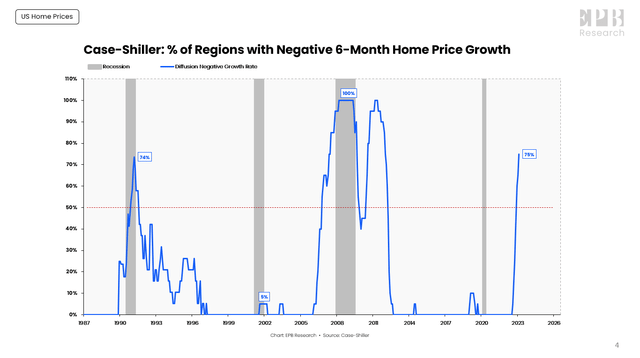
We are clearly in the middle of another home price downturn since the declines have been about 3%, the duration has lasted 10 or 11 months, and 75% of cities are showing declining home price growth.
We can debate the magnitude, and in the next section, we’ll compare this home price decline across a larger sample of history.
But first, we have to look at the dispersion of home price declines and see where home prices are falling the most and where home prices have held up the best because the conversation about real estate is very divided.
Some people think home prices in their city are falling, while others have barely seen a correction, and this data shows why both are true.
This chart shows the depth and duration of the home price downturn in the 20 major cities across the country. The left axis measures the % decline from the peak, and the bottom axis measures the duration of home price declines.
Case-Shiller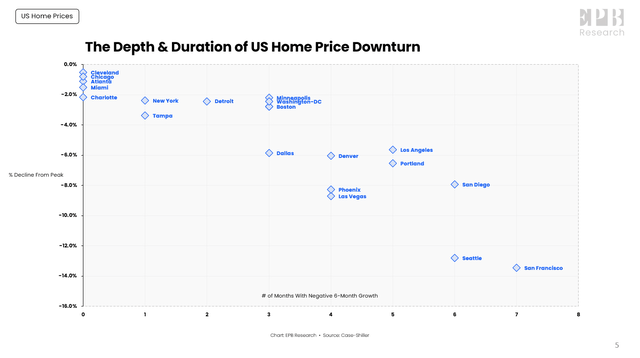
The upper left shows the areas that have been least affected, and the bottom right shows where the housing downturn is hitting the hardest.
Cleveland, Chicago, Atlanta, Miami, and Charlotte have seen virtually no correction at all, with home prices within 1% or 2% from their peak levels and no consistent declines.
On the other extreme, San Francisco, and Seattle have seen prices decline almost 15% in less than a year. This is on par with 2008-type declines.
In the middle, we see cities like Dallas, Denver, Phoenix, Las Vegas, Los Angeles, and Portland where there has been a clear shift, and home prices have fallen about 6%-10%.
So there is no doubt, based on depth, duration, and dispersion, that the US is nationally in a home price downturn. Depending on the location, the downturn is anywhere from non-existent to severe, with the national average so far in a moderate correction.
How Does This Downturn Compare To A Longer History?
If we want to compare housing cycles across a longer period of time, we have to look at home prices in real terms or adjusted for inflation.
There are a few reasons why looking at real or inflation-adjusted home prices is appropriate.
Housing is very important for the wealth effect. When home prices rise, people feel wealthier, and it is very common to refinance and pull equity out of a property to use on consumption or more real estate assets.
This only works if the home price is rising in real terms, or else the cash you pull out of the home can’t support the consumption of other goods rising even faster in price.
During periods of high inflation like the 1970s, home prices may rise in nominal terms but fall sharply in real terms.
When we look at real home prices, we can see that prices generally decline around recessions. This makes sense. The duration of the corrections and the magnitude of the corrections vary, but they are generally centered around recessionary periods.
Case-Shiller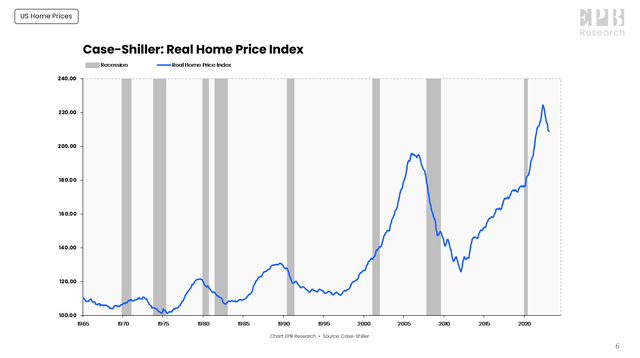
Real home prices were more stable in the four decades from 1960 through 2000 before taking on what can only be described as boom-bust type growth, rising 75% from 1997 through 2006 and rising 78% from 2012 through 2022.
Real home prices peaked on a national level in May 2022. The peak was earlier for some cities like San Francisco, and later for places like Miami, but in real terms, home prices have peaked everywhere.
At this point, we’re only going to refer to the national average.
The US housing market has had six major downturns since the 1960s. Home prices declined around all the recession periods except 2001 and the COVID recession.
Case-Shiller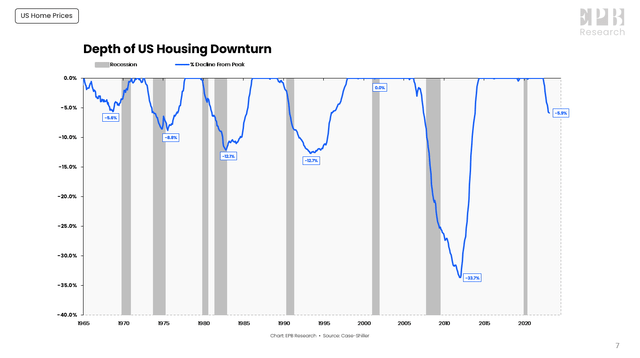
Real home prices have declined about 6% since May 2022.
In terms of duration, during past housing downturns, real home prices declined for 33 to 70 months, with the exception of 2000, which saw no declines at all, not even in real terms.
Case-Shiller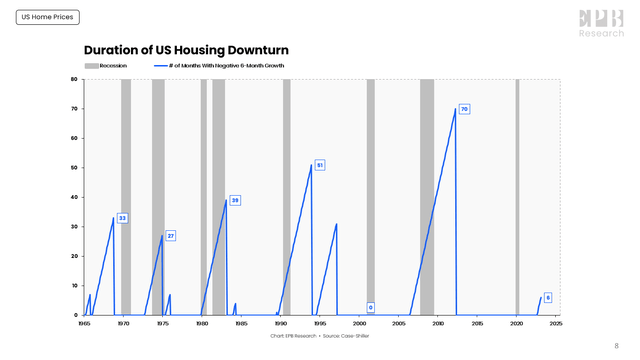
The other important point is that home prices tend to bottom at the end of the recession or after the recession. Home prices are a slow-moving, lagging indicator with a full housing cycle often taking 3-5 years.
So in the six major housing downturns, including the extreme 2008 scenario and the no-decline 2000 scenario, the average recession brings a real-home price decline of roughly 12%, with declines that last for 37 months.
Case-Shiller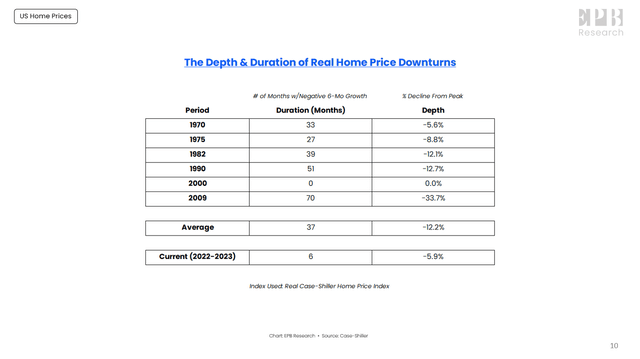
Currently, home prices have declined for six consecutive months and are about 6% from the peak in real terms, but the economic downturn and most of the recession are still in front of us, so declines will likely continue and reach at least the historical averages.
Leading indicators of real home price growth are still moving to the downside, something we cover in our Quarterly Real Estate Deep Dive reports.
Summary
In summary, the US housing market is in the middle of an ongoing downturn, with prices declining in 75% of cities. The declines are not evenly distributed. Some cities are showing substantial declines before any significant crack in the labor market, which is concerning, but some cities have only just seen the momentum slowdown without any sizeable reductions in price.
Where the housing market bottoms in relation to past economic downturns remains an open question, but there is no debate that the market hit a clear peak in 2022, and the broad momentum remains to the downside.
Read the full article here


