
(Data below is sourced from the Virtus website unless otherwise stated.)
Fund History
The Virtus Total Return Fund (NYSE:ZTR) was originally created in 2005, but it originally traded under the ticker DCA. In April 2017 it merged with the Zweig Fund and the ticker then changed from DCA to ZF. The fund strategy also changed at that time.
Fund Merger
On July 3, 2019, Virtus announced a proposed merger of ZF with ZTR. The fund’s historical performance prior to 11/18/2019 reflects the performance of ZF, which was the accounting survivor when the funds merged.
Fund Objectives
The Fund’s investment primary objective is capital appreciation, with current income as a secondary objective. The Fund invests around 60% of total assets in equity securities and 40% in fixed income.
The equity portion of the fund is really more of a sector fund. It invests in securities that tend to do better in a “risk off” environment with global investments in owners/operators of infrastructure in the utilities, industrials, energy, real estate, and communications industries.
The fixed income portion of the Fund is designed to generate high current income and total return by using active sector rotation, extensive credit research and risk management designed to capitalize on opportunities across undervalued areas of the fixed income markets.
Discount History
The fund is currently trading at an 11% discount to NAV, which is much less than its average 2.5% discount over the last three years.
Below is the three-year discount history from cefconnect for ZTR. It is interesting that ZTR traded at a premium between March 2021 and July 2022. But a right offering completed in Sept. 2022 caused a negative “sea change” in investors’ opinion of the fund, and it has traded with a discount since then.
ZTR Three Year Discount History
ZTR Discount History (cefconnect)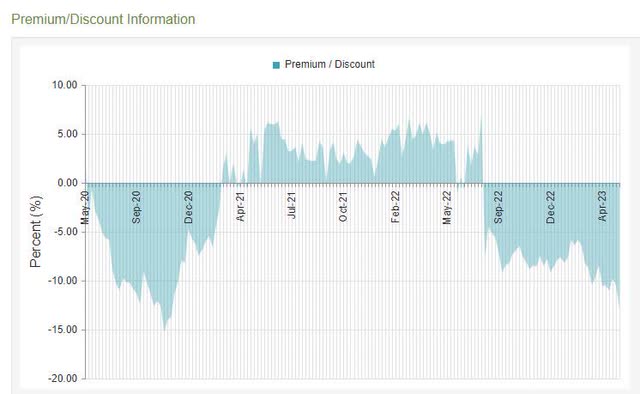
Portfolio Allocations
Here are the ZTR equity and fixed income sector allocations as of March 31, 2023.
ZTR Equity Allocation (Virtus web site) ZTR Fixed Income Sectors (Virtus web site)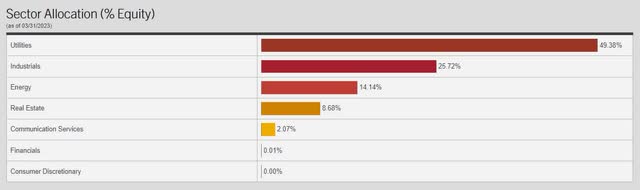

Top Ten Portfolio Holdings As Of February 28, 2023
|
Ticker |
Holding |
% Portfolio Weight |
|
(TCL) |
Transurban Group |
5.27 |
|
(NEE) |
NextEra Energy Inc |
4.04 |
|
(AMT) |
American Tower Corp |
3.77 |
|
(LNG) |
Cheniere Energy Inc |
3.11 |
|
(OTCPK:ANNSF) |
Aena SME SA |
2.93 |
|
(CCI) |
Crown Castle Inc |
2.58 |
|
(SRE) |
Sempra Energy |
2.40 |
|
(NG) |
National Grid PLC |
2.31 |
|
(D) |
Dominion Energy Inc |
2.30 |
|
(AEP) |
American Electric Power Co |
2.15 |
Source: Morningstar
ZTR Country Breakdown (Virtus web site)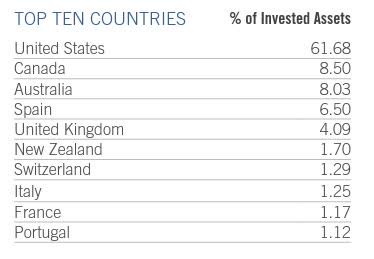
Fund Correlations Table
There are a number of CEFs that are highly correlated with ZTR. The table below shows the NAV correlation for these funds along with the (XLU) utilities ETF. The other closely correlated CEFs generally trade at premiums to NAV or narrower discounts, with the exception of (GLU) which trades at a similar discount to ZTR.
Note that the correlation with the infrastructure fund (UTF) is especially high at 0.95. UTF is one of the largest CEFs and currently trades at a 5% discount.
ZTR Fund Correlations (Portfolio Visualizer)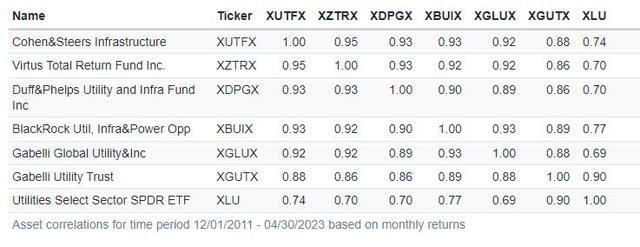
Source: Portfolio Visualizer
Fund Performance
ZTR and its predecessors have had decent longer term performance, but looking backward at past performance is not very meaningful here because of several fund mergers and changes to the investment strategy over the years.
The more recent year-to-date performance of ZTR in 2023 has been well below the performance of the S&P 500. Part of the reason for this is because ZTR is a 60-40 balanced fund. But the main reason for the underperformance is that ZTR does not hold any of the top tech stock performers in the S&P 500.
ZTR YTD= -1.75% SPY YTD= +10.05%
Below is a table of the top ten holdings of the S&P 500. With the exception of UNH, the other nine holdings have strong positive year-to-date returns for 2023 with exceptional returns for NVDA and META. Note that NONE of these top ten S&P 500 stocks are held in the ZTR portfolio. This goes a long way toward explaining why ZTR’s performance has lagged the S&P 500 by so much this year.
|
Ticker |
2023 YTD |
% S&P500 |
% ZTR |
|
(AAPL) |
34.73% |
7.40 |
0.0 |
|
(MSFT) |
32.82% |
6.74 |
0.0 |
|
(AMZN) |
40.65% |
2.99 |
0.0 |
|
(NVDA) |
116.76% |
2.22 |
0.0 |
|
(GOOGL) |
39.22% |
2.08 |
0.0 |
|
(GOOG) |
39.21% |
1.82 |
0.0 |
|
(BRKB) |
6.75% |
1.69 |
0.0 |
|
(META) |
105.13% |
1.56 |
0.0 |
|
(TSLA) |
43.60% |
1.35 |
0.0 |
|
(UNH) |
-9.61% |
1.27 |
0.0 |
Fixed Income Rating Distribution (as of 03/31/2023)
ZTR Ratings Distribution (Virtus web site)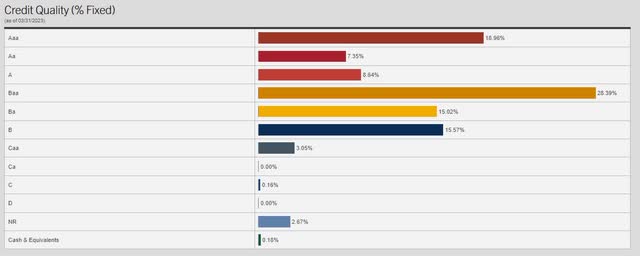
Managed Distribution Plans
ZTR has been paying a steady managed distribution of $0.08 monthly since June 2020. If you owned ZTR in a taxable account, this is the tax dividend breakdown for the year 2022 and for the three years 2020-2022:
|
ZTR Tax Dividends |
2022 |
2020-2022 |
|
Income |
21.5% |
21.4% |
|
QDI |
17.8% |
18.0% |
|
Long Term Gains |
27.9% |
9.3% |
|
Return of Capital |
50.6% |
69.3% |
Source: cefdata.com
Closed-End Funds With Very High Distribution Yields
I have compiled a table below with a list of closed-end funds that pay out steady managed distributions of 15% a year or higher.
You can see that most of these funds trade at premiums over NAV or small discounts. There are three exceptions with discounts in double digits:
- CUBA: A “funky” equity CEF that invests in equities related to Cuban tourism. It has a sky-high expense ratio of 3.47% which explains the discount.
- OPP: This fund has done multiple rights offerings that have hurt investors and also has a high expense ratio of 1.93%.
- ZTR stands out as a notable exception since it currently trades at an 11% discount with a moderate baseline expense ratio of 1.32%. With the passage of time, ZTR should eventually trade at a narrower discount or possibly even a premium again. But this assumes that management will refrain from doing destructive rights offerings going forward.
CEFs With Managed Distribution Yields > 15%
|
Fund |
Distribution Yield |
Premium or Discount |
|
OCCI |
24.75% |
– 7.20% |
|
CRF |
18.89% |
+17.88% |
|
CLM |
18.87% |
+17.62% |
|
ACP |
18.21% |
– 3.94% |
|
CUBA |
17.81% |
-18.77% |
|
EDF |
17.65% |
+ 3.55% |
|
ECC |
17.50% |
+25.80% |
|
OXLC |
17.31% |
+16.59% |
|
EDI |
17.00% |
+ 5.56% |
|
SRV |
16.34% |
– 7.47% |
|
FCO |
16.31% |
+27.48% |
|
ZTR |
15.87% |
-11.16% |
|
XFLT |
15.77% |
+ 4.02% |
|
OPP |
15.10% |
-15.84% |
Source: cefconnect
Virtus Total Return Fund Inc.
- Total Investment Exposure= $678 MM
- Total Common Assets= $471 MM
- Annual Distribution Rate= 15.87%
- Dividend Frequency= Monthly
- Current Quarterly Distribution= $0.08 per share ($0.96 annually)
- Baseline expense ratio= 1.32%
- Annual Portfolio Turnover Rate= 46%
- Discount to NAV= -11%
- 6-month Avg. Discount= -8.7%
- Effective Leverage= 30.5%
- Average 3 Mos. Daily Trading Volume= 219,538 shares
- Average 3 Mos. Daily $ Volume= $1.3 Million
Sources: cefconnect, Yahoo Finance
Alpha is Generated by Discount + High Distributions
The high distribution rate of 15.87% along with an 11% discount allows investors to capture “alpha” by recovering a portion of the discount whenever a distribution is paid out.
Whenever you recover NAV from a fund selling at a 11% discount, the percentage return is 1.00/ 0.89 or about 12.35%. So the alpha generated by the 15.87% annual distribution is computed as:
(0.1235)*(0.1587)=0.0196 or about 200 basis points a year in discount capture.
This more than offsets the 1.32% annualized baseline expense ratio as reported on the fund web site. Note that this discount capture “alpha” occurs whether or not the discount narrows. As the fund keeps paying out the managed distributions, some alpha is produced even when the discount remains the same. Of course, a narrowing of the discount is even better and adds significantly to the alpha generated.
ZTR has been trading over 200,000 shares a day and has decent trading liquidity. The bid-asked spread is usually only a penny, and you usually get some price improvement on smaller market orders.
ZTR looks decent now as a defensive holding that gives you some equity exposure. It should hold up reasonably well if there is a stock market correction, or we go into more of a “risk off” market environment. It combines conservative equity infrastructure investments with a diversified fixed income portfolio.
Editor’s Note: This article covers one or more microcap stocks. Please be aware of the risks associated with these stocks.
Read the full article here

