
By Tajinder Dhillon
Large-cap U.S. equities have rallied year-to-date by approximately nine percent (as of May 29th) and appear to show resiliency in the face of a potential recession. However, when dissecting the index and going ‘underneath the hood’, we note that the year-to-date performance from a contribution perspective has been solely driven by the ‘Big 8’ group which consists of Apple Inc. (AAPL), Microsoft Corporation (MSFT), NVIDIA Corporation (NVDA), Amazon.com, Inc. (AMZN), Meta Platforms, Inc. (META), Tesla, Inc. (TSLA), and Alphabet Inc. (GOOG, GOOGL).
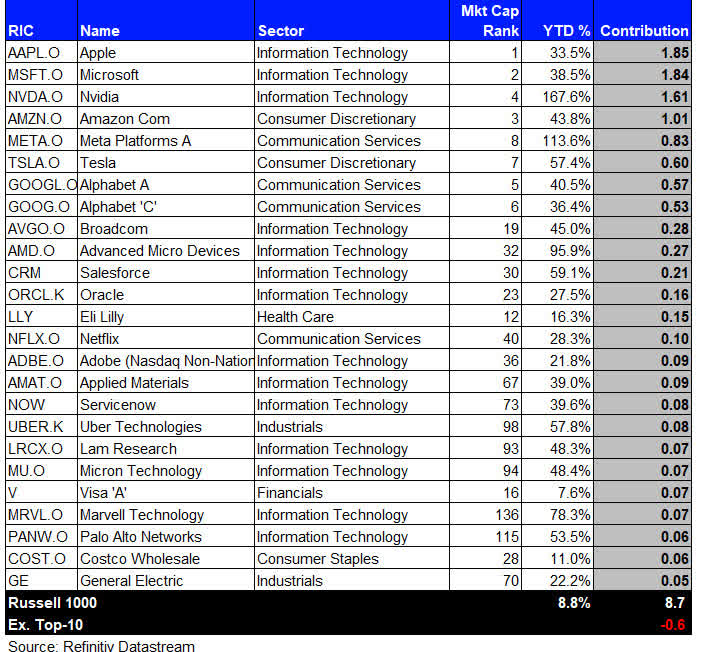
Using Refinitiv Datastream, we look at the Russell 1000 and find that the top seven companies ranked by market capitalization (eight constituents, including dual share classes for Alphabet) have contributed 8.8 percentage points to the overall index. Said differently, the group combined have contributed 100% of the overall index return, as shown in Exhibit 1.
When excluding these companies, the index has declined by approximately 0.6 percentage points, which starkly highlights the narrow breadth shown in large-cap equities. More specifically, if we exclude the top 50 constituents by return contribution, the Russell 1000 would be in the red by approximately three percent.
Exhibit 1: Russell 1000 YTD Performance by Contribution
‘Big-8’ Market Cap Weight
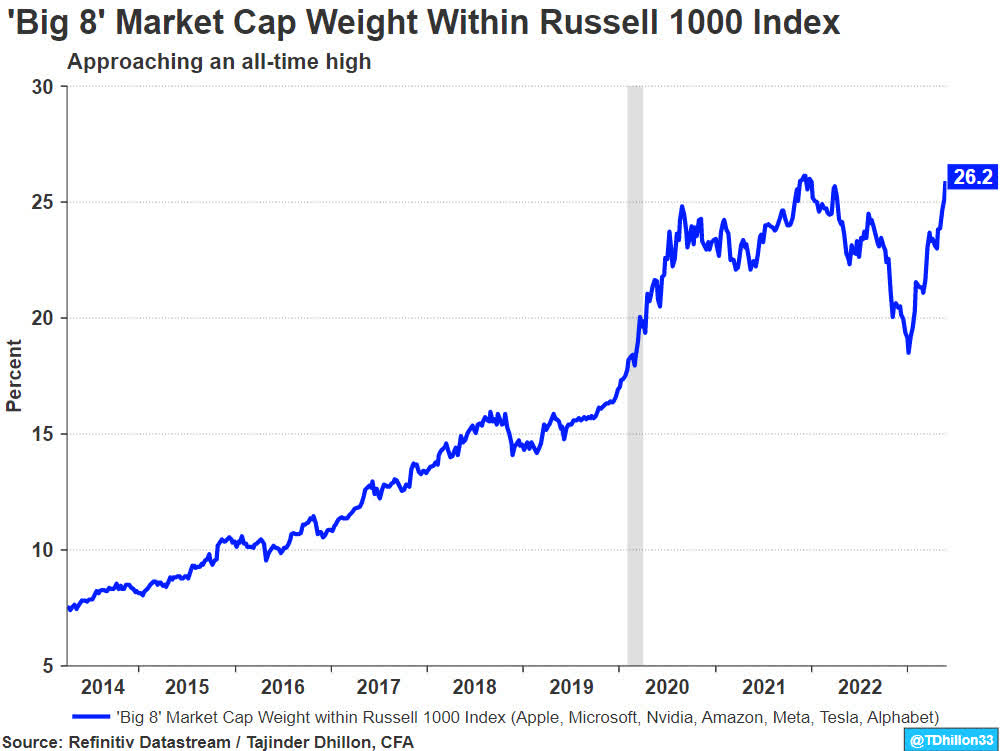
The outperformance of the ‘Big 8’ group has seen its market cap weight within the Russell 1000 index rise to a near all-time high (26.2%), well above the long-term average of 15.9% and median of 15.0% (Exhibit 2).
For further context, the ‘Big 8’ group has a market cap weight of 49.0% in the Russell 1000 Growth Index.
Exhibit 2: ‘Big 8’ Market Cap Weight
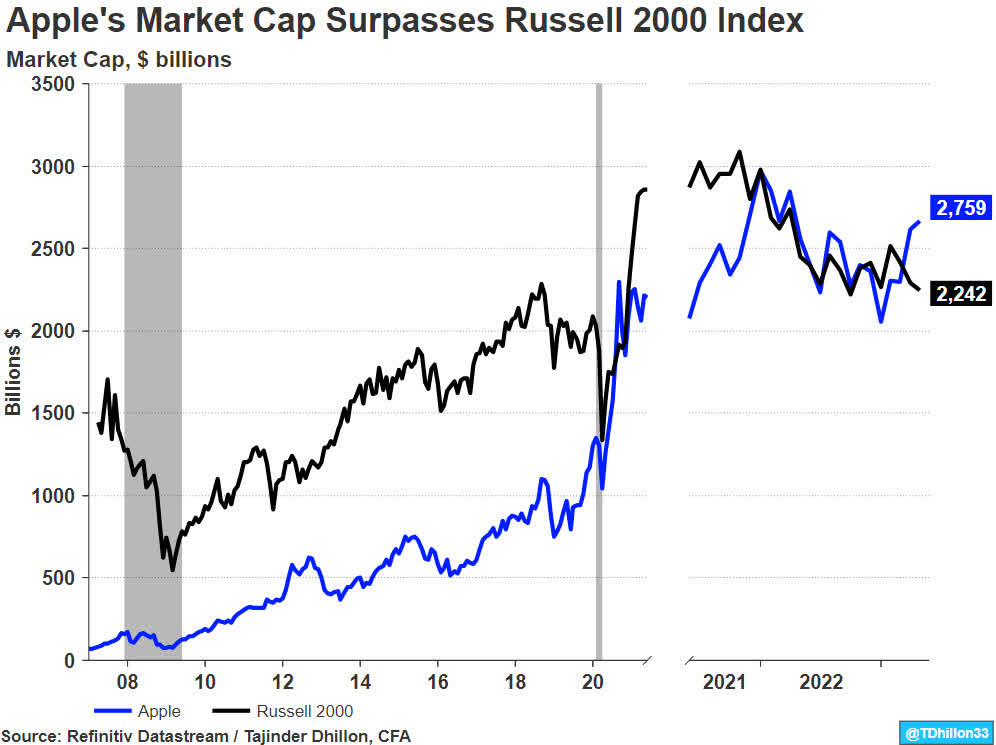
To put the mega-cap companies into further perspective, we observed in March that Apple Inc.’s market capitalization of $2.75 trillion exceeded the entire market cap of the Russell 2000 Index ($2.24 trillion) (Exhibit 3).
Exhibit 3: Apple Market Cap vs. Russell 2000 Index
‘Big-8’ have High Expectations
The ‘Big 8’ tend to be highly profitable companies who are resilient during periods of economic weakness, while many companies in this group are at the forefront of driving artificial intelligence into real world applicable scenarios.
What’s priced in is a question being asked a lot these days. How much of this current and future news is now fully reflected in stock prices? With so much uncertainty facing markets, we turn to the StarMine Intrinsic Valuation model.
Used conventionally, this is a three-stage Dividend Discount Model that uses sell-side estimates for individual equities, adjusts those according to analyst accuracy and the age of the estimate (which we have named the SmartEstimate™), and then for analyst bias. There is an optimism bias in most estimates, especially in the forecasts for fast-growing companies and estimates that are further into the future. The resulting bias-adjusted EPS growth rates are then converted into a string of dividends and discounted back to the present to calculate Intrinsic Value (IV), known as its inherent value, rather than relative to peers or by its P/E ratio.
Within the IV model, we’ll use the alternative calculation this quantitative model generates – Market Implied Growth (MIG). To derive this, it uses the IV framework to solve backward. It sets the last closing price as “fair value” and then solves for the growth rate required to justify that price. In using this, you can begin to contrast your expectations for growth to market expectations and answer the question, ‘How much growth is currently priced in.’
We highlight MIG for NVIDIA Corporation in Exhibit 4, who joined the $1 trillion dollar market cap club on May 30.
Exhibit 4: StarMine Intrinsic Valuation for NVIDIA
Source: Refinitiv Workspace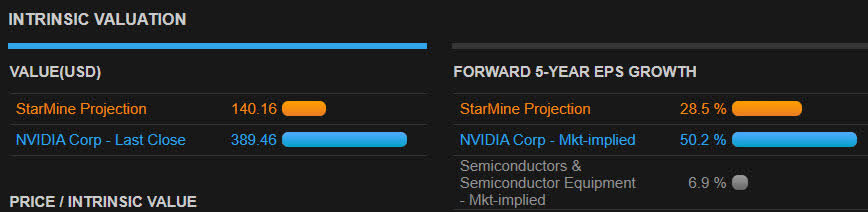
As shown in Exhibit 4, the market has priced in very high growth expectations with the positive 5-year compounded annual growth rate of 50.2%. In other words, these are the percentage increase EPS would have to increase by each year, for the next five years, to justify the current price. This is well above the industry average of 6.9% and almost double the growth projection defined by StarMine at 28.5%.
This suggests that a company like NVIDIA is currently a ‘high-expectation’ stock, leaving it minimal wiggle room for disappointment. For reference, every company in the ‘Big-8’ is currently a ‘high-expectation’ stock using the analogy outlined above.
Original Post
Editor’s Note: The summary bullets for this article were chosen by Seeking Alpha editors.
Read the full article here

