Introduction
This article is part of the “Riding The Rails Of Profit” series. I am writing it to share further research on North-American railroads, always keeping the BNSF case study as the model to start from. This time we will look at Canadian Pacific Kansas City (NYSE:CP). Please be aware that financial data are reported in CAD.
Summary of Previous Coverage
Railroads are often considered a back-bone of an economy. However, sometimes they tend to be shunned by investors because of the capital intensive nature of their business. Even Warren Buffett had to overcome this hurdle before he bought a whole railroad for Berkshire (BRK.A) (BRK.B). When Buffett understood that capital intensive is not equal to bad business, he explained over and over to Berkshire’s shareholder the importance of the BNSF acquisition. It is from his lessons that I started getting interested in railroads. After some research, I shared my first findings in the article “Learning from Buffett and Berkshire About Investing In Railroads: The BNSF Case Study“. Here, I wrote a few things I had been learning from Buffett and the criteria he used to assess his railroad and deem it worth of a big investment as his. We learned together how Buffett values a lot the following aspects: earning power (how well interest expense is covered), efficiency (operating ratio, fuel consumption), use of capital (only excess capital should be returned).
Then I started publishing some research using the same method to look at the other 5 publicly traded Class 1 railroad companies. You can find them in my SA profile by searching for the respective ticker symbols. Recently, I came back to BNSF and shared a deeper research on the total returns Berkshire had from this investment.
In this article, I would like to share a similar analysis on Canadian Pacific (CP). Yes, you read it right: Canadian Pacific and not Canadian Pacific Kansas City. Why is this? Because this new series is focused on reading through the past of the major Class 1 railroads to assess what direction they are going and what we can expect from the future. Therefore, in the case of the recent M&A which led to the birth of Canadian Pacific Kansas City Ltd, I think it is quite interesting to know what path Canadian Pacific went through to become able to make such an acquisition.
So far, Canadian Pacific has been a company on my watchlist that I still haven’t bought. According to Buffett’s metrics, the company seems, in fact, a bit overvalued. True, it owns a unique network and, thanks to the new acquisition, it will be the only railroad serving all three North-American countries. However, it didn’t score the best results when assessed with the same criteria Buffett used to buy BNSF.
Operating History
Freight revenues
The first thing we have to deal with to understand the revenue mix a railroad has. This enables us to assess if the company is diversified or if it is exposed to any particular source of revenue.
Now, Canadian Pacific reports its revenue under the following categories: grain, fertilizer & sulphur, metals, mineral and consumer products, coal, forest products, automotive, potash, energy, chemical and plastics, intermodal.
As we can see from the graph below, since 2012 CP has overall increased its revenues. In particular, over this time-span, grain grew 51%, potash 107%, forest products 109%, and energy 94%.
Only coal had negative growth of -4%, while automotive revenue stayed flat at +3% since 2012.
Author, with data from CP Annual Reports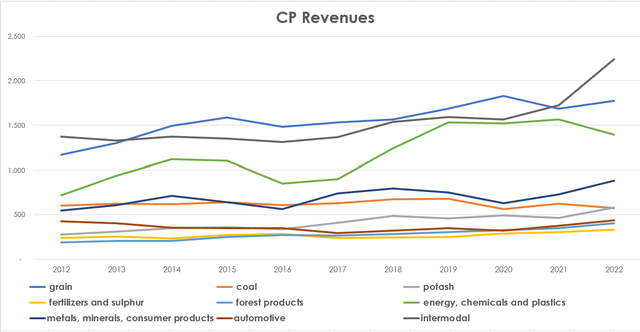
Canadian Pacific spreads its revenue across different categories. As we can see from the columns below, grain makes up about 20% of the yearly revenue, with energy having a 16% weight and intermodal coming it at 26% of total revenues.
Author, with data from CP Annual Reports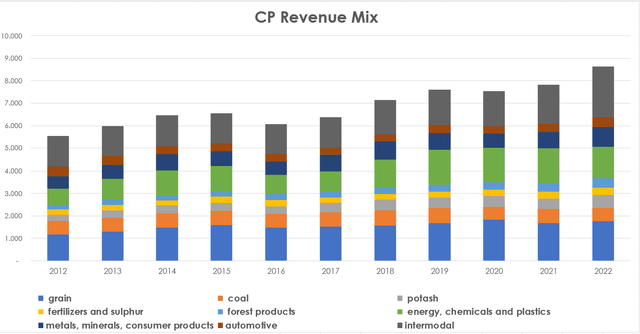
We know by now that railroads need to report the number of carloads they moved during the quarter. This allows us to understand whether the company is being able to transport high-value freight or not.
Here, we see something very positive: over these past eleven years, CP has been able to steadily increase its revenue per carload, as shown from the orange line in the graph below.
This is quite interesting since the number of carloads is a little more volatile and experiences more ups and downs than other metrics. This is shown by the blue columns in the graph below, where a certain cyclicality can be seen. However, it seems like Canadian Pacific, no matter how the economic environment goes, has been able to squeeze more value out of every carload it has moved on its network.
Author, with data from CP Annual Reports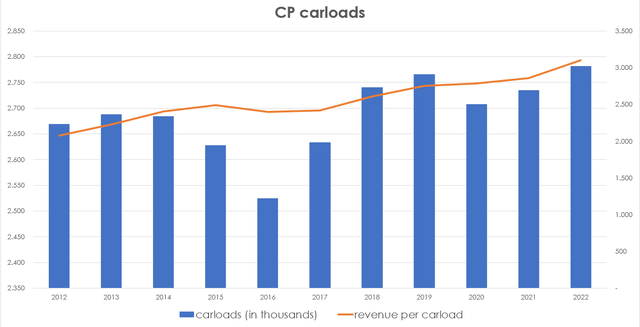
Operating efficiency
Having seen how Canadian Pacific has been able to increase its revenue per carload throughout the years, we have moved closer to what many consider the core of the industry: operating efficiency. In fact, since railroads need to build new tracks to expand their reach, it is not that easy to grow earnings through a strategy seeking geographical expansion. So, since what drives the top line up is somewhat limited, railroads need to work on everything that stays between their revenues and their net incomes. In other words, railroads need to manage well their opex.
Canadian Pacific provides us with this pie chart and a table where we can keep track of its operating expenses.
CP 2022 Annual Report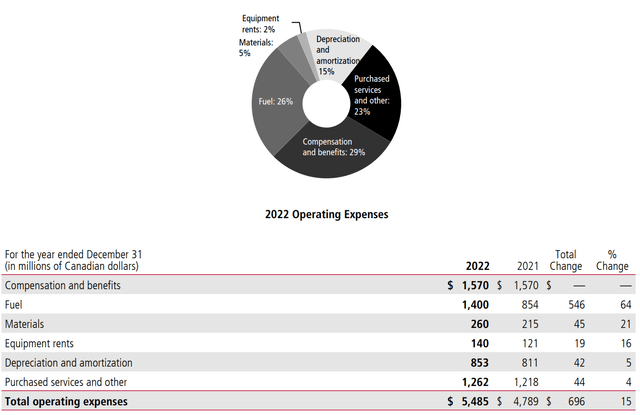
At the end of 2022, Canadian Pacific had a total workforce of 12,824. This represented an increase of 952 units over the previous year. Many railroads reduced their headcount during the pandemic, to then start hiring once again as the economy recovered and the need to move freight around the continent increased.
Why are we talking about this? Because, as we can see from the table above, compensation and benefits is by far the largest expense, with a 28.6% weight on the total. The other major expenses during the year was fuel. This is a very volatile expense. However, as railroads normally do, Canadian Pacific is able to offset almost completely this expense thanks to its fuel surcharge program. In 2022, for example, its fuel surcharge revenue was $1,303 million, which is almost equal to the $1,400 million the company spent on fuel.
Overall, in 2022 the company reported an operating ratio of 63.6%, well above the industry average. This is quite an important metric because it shows how efficiently a company is run.
In any case, since 2012 the company has been able to generate almost $76 billion of revenues and an operating income of $26 billion. This means that, on average, the company has been able to convert approximately 34% of its revenues into operating income. This is quite valuable.
Operating expenses: employee compensation, fuel (and fuel surcharge), purchases services, D&A
Balance Sheet History
Let’s take a look at the development of Canadian Pacific’s balance sheet over the years so that we can understand what happened to its capital structure.
Author, with data from CP annual reports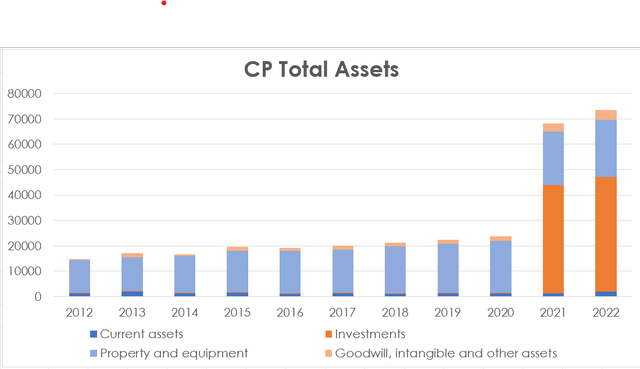
Let’s look at what happened for 2012 to 2020. In light blue we see how property and equipment had the lion’s share of total assets, with an increase of 63% from $13 billion to more than $20 billion. No surprise, we are considering a railroad, where property and equipment do require a lot of financial resources. Why do we see a big spike in 2021 and 2022? Well, the answer is simple, Canadian Pacific made its bid for Kansas City Southern.
We can also look at the other side of the balance sheet, where liabilities and shareholder equity are reported. Again, from 2012 to 2020, it doesn’t seem a concerning balance sheet, with LT being almost always below $10 billion.
Author, with data from CP annual reports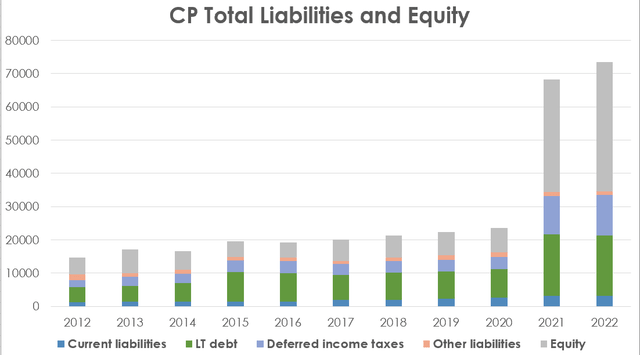
When the investment in Kansas City Southern began to take shape, LT debt more than doubled, with equity increasing even more. This created a situation that puts some financial stress on the company. However, Canadian Pacific has used all its dividend received form KCS to de-lever its balance sheet and paying down debt. Just in Q1 of this year, the company reduced its debt by $490 million.
In 2023, Canadian Pacific will only face $1.5 billion of annual debt maturities. Most of these maturities are due after 2027, since $13.5 are reported as belonging to the years after 2027.
Overall, I think Canadian Pacific can handle this increased debt. It has the tools, as we will see in a moment, to create enough earning power to meet all its obligations.
Free Cash Flow History
We are now at one of the most important parts of these articles: the overview on a railroad’s cash flows.
In fact, as we saw in the first article of the series, free cash flow is a better indicator than net income to assess what cash can be taken safely out of a company without endangering it. In fact, net income comes after we subtract depreciation expenses. However, depreciation is usually lower than replacement costs, which can be seen under capex. It is capex that reports the true replacement cost of an asset.
Since 2012, Canadian Pacific has made $26.2 billion of operating income. At the same time, capex required the company to spend $15.8 billion. This leaves us with around $10 billion of free cash flow.
Author, with data from CP annual reports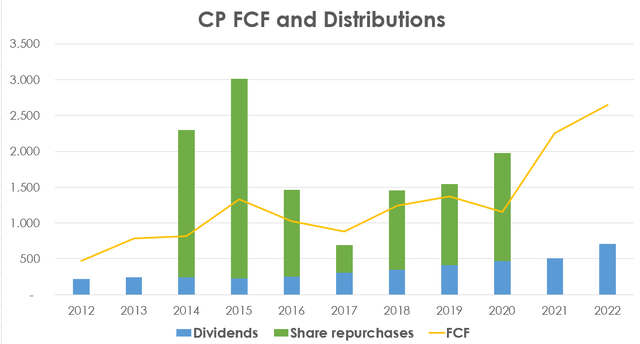
What has Canadian Pacific done with its free cash flow? We can see how the company change its use over the years. Before 2014, the company didn’t have a buyback program and thus used its FCF to fund its dividends while stacking up in cash a big part of it. Then, in 2014, the company started to repurchase its own shares and this brought more than once the total of the distributions above the available free cash flow. In other words, Canadian Pacific not always funded its shareholder distributions with its own cash. It actually had to take on some debt to increase this program. However, the company rightly decided to pause its buybacks as it completed the KCS acquisition. Giving priority to reducing its debt is a move I like because it creates a better situation for the company in the years to come. In addition, in the past two fiscal years, free cash flow really grew up and this helped the company find itself with more available cash than expected to reduced its debt.
Conclusion
This article didn’t aim at offering a particular deep-dive into the new company, but, rather, to see what way Canadian Pacific went through to be found ready for the big acquisition of Kansas City Southern. I actually plan on writing a similar article on this railroad, to match this article on Canadian Pacific. In this way, we will have before our eyes the most recent history of a railroad whose acquisition may have been the creation of a unique company set to prosper.
So far, I still haven’t bought Canadian Pacific, though I am keeping it on my watchlist. There are some reasons why I consider the company still a hold. In fact, it is trading at higher multiples compared to its peers. In addition, it is currently a bit too leveraged and, while the company is moving in the right direction to address this issue, shareholder should not expect buybacks to start anytime soon. This is why I set $70 as my trigger price for a buy.
Nonetheless, the company is a terrific pick for its railroad network and its well diversified revenue stream. Owning Canadian National (CNI), I wouldn’t mind owning Canadian Pacific, too but at the moment, there is a difference of valuation which makes me slightly prefer Canadian National.
Read the full article here


