This article was first released to Systematic Income subscribers and free trials on June 18.
Welcome to another installment of our CEF Market Weekly Review, where we discuss closed-end fund (“CEF”) market activity from both the bottom-up – highlighting individual fund news and events – as well as the top-down – providing an overview of the broader market. We also try to provide some historical context as well as the relevant themes that look to be driving markets or that investors ought to be mindful of.
This update covers the period through the third week of June. Be sure to check out our other weekly updates covering the business development company (“BDC”) as well as the preferreds/baby bond markets for perspectives across the broader income space.
Market Action
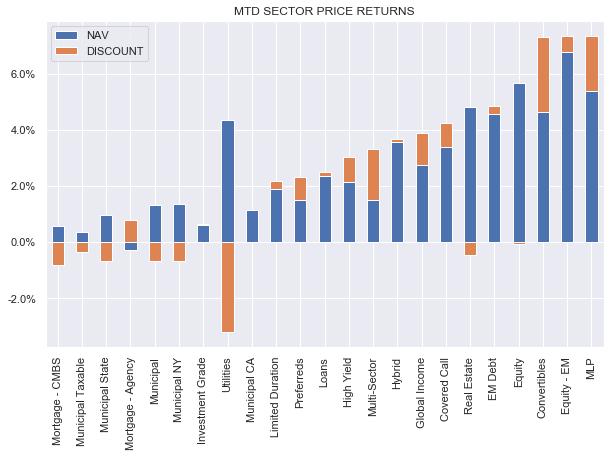
CEFs were mostly up on the week as strong risk sentiment pushed up stock prices and tightened credit spreads. Higher-beta sectors like Convertible and Equity CEFs outperformed. Month-to-date, all sectors save for CMBS are up.
Systematic Income
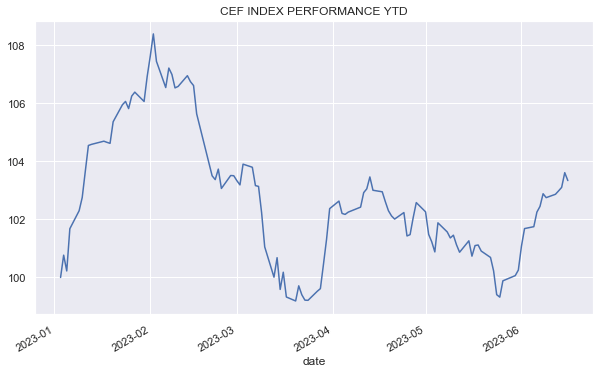
CEFs have bounced higher from their recent trough and are trading at the upper part of their 4-month range.
Systematic Income
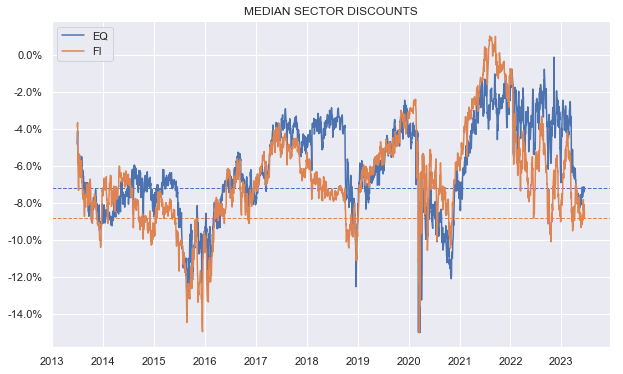
Discounts remain fairly wide as recent positive sentiment has not translated into significant discount tightening. This is possibly in response to the fact that the Fed has flagged up two more potential hikes which is likely to keep distributions under pressure.
Systematic Income
Market Themes
One of the key risks for CEF investors has to do with, what we call, a triple whammy, of underperformance, reduced distributions and premium deflation. These kinds of triple whammies can do serious damage to investor portfolios and limit total wealth creation. This triple whammy recently happened with the Duff & Phelps Utility and Infrastructure Fund (DPG) which we discuss here.
DPG cut its distribution the other day by 40% from $0.35 to $0.21. It maintained the original $0.35 distribution since inception which has grown to 12.5% relative to the NAV (as a result of NAV deflation). Until now the fund had a “stable managed distribution policy” where it would try to pay out $0.35 through net income, realized gains or ROC. Over the last 2 years the fund has generated $0.12 in annual net income which comes to around a net investment income yield of 1% on NAV.
Extremely low coverage for CEFs that hold stocks (even high dividend stocks) is very common so by itself it’s not a red flag. A red flag is when an equity CEF is not able to generate long-term returns commensurate with its distribution. DPG 10Y total NAV return is 2.9%. This might be OK if the stock market were down 50% but stocks are fine (Utilities are a bit below where they were at the start of 2022). Needless to say at some point a 3% annual return can’t support a 12.5% distribution.
What’s ironic here is that DPG was one of the worst performers in the Utilities CEF sector (worst by 10Y total NAV returns and second worst by 5Y total NAV returns). Despite that, it traded at a 13% premium (second highest in the sector and 13% above the median valuation). No prizes for guessing why its valuation was so rich despite its poor return (its distribution was the highest in the sector). No prizes once again for guessing what has now happened to the price of DPG in light of the distribution cut (it’s down over 20%).
All of this creates a kind of triple whammy for low-information investors. Underperforming CEFs that don’t like cutting the distribution will tend to have a relatively high distribution rate (because their NAV will tend to fall more than that of other funds due to underperformance and due to overdistribution being financed by the NAV). This causes the fund’s valuation to richen as low information investors flock to the fund.
In the end, investors get 1) underperformance in total NAV terms, 2) an eventual distribution cut, resulting in a very disappointing yield on their cost basis and 3) a valuation collapse, resulting in poor total price return.
Income allocation is as much (if not more) about playing defense as offense and avoiding triple whammies is a key part of the defense playbook.
Market Commentary
A couple of semi-annual CEF shareholder reports have come out recently. The CLO Equity / Loan CEF (XFLT) saw an increase in net income of about 15% from the previous fiscal year. Given what’s happened to Libor over the last 6 months or so there is probably another 15% net income boost on the cards given the lags with which CEFs report their net income and the fact that semi-annual reporting covers a very wide earnings period.
This is to be expected – XFLT has a floating rate asset profile and has a fixed-rate preferred that is about a quarter of its leverage. The fund also tends to avoid deleveraging when the NAV falls. While this helps keep net income elevated, it also boosts the fund’s leverage – leverage now is above 40% – which is fairly high given the high-beta assets of the company’s portfolio.
Taking a look at shareholder reports from CMBS CEF (IHIT) and preferred CEF (JPI). Both funds have seen a drop in net income from the prior reporting period. The drops in the reports however will tend to overstate the fund’s cashflows as not all cashflows will feed into income. For example, JPI receives Libor (i.e. 5+%) and pays around 2% on its interest rate swaps for a net cashflow of 3% on $157m. What net income will flag up is the 6% or so that the fund pays on its $265m of borrowings but not the 3% that comes back on $157m. The story is similar with IHIT. This is one of the ways that GAAP net income can be misleading.
Both IHIT and JPI are term CEFs with JPI likely to offer investors a tender offer at NAV, monetizing its 6% discount. We currently hold JPI in our income portfolios.
Read the full article here


