This article was first released to Systematic Income subscribers and free trials on June 20.
In this article we catch up on the latest quarterly results of the Barings BDC (NYSE:BBDC). The company delivered a strong result with a 3.4% total NAV return, outperforming the sector over the quarter.
BBDC has seen a number of challenges over the past year. Most obviously, its valuation has cratered to a level rarely seen in the BDC space. Out of around 30 names in our coverage it has the second lowest valuation.
Other challenges include the company losing its CEO, CFO and 2 chief compliance officers in short succession. The company also did not distinguish itself by investing in bitcoin miner Core Scientific which went bankrupt late last year. Finally, the company is in the process of integrating legacy portfolios which have seen a rise in non-accruals.
Longer-term as well as recent performance suggests the stock’s price is not far from fair-value. Perhaps the best that can be said about BBDC is that other BDCs with a similar longer-term return are expensive (and warrant a rotation to BBDC) and that the stock could see a pop on the back of a couple of catalysts we discuss below.
Quarter Update
The company’s net investment income fell sharply to $0.26 from $0.34.
Systematic Income BDC Tool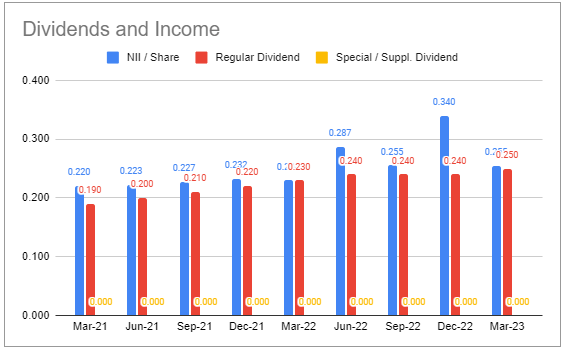
However, this was due entirely to a large catch-up in incentive fees as shown in the table below
Systematic Income BDC Tool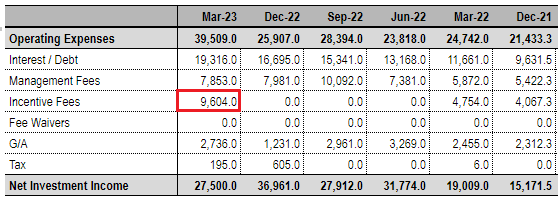
If incentive fees normalize towards the $6-7m range as guided by management, we should see net income come in closer to $0.32-0.34 range, well above Q1 level and well in excess of the $0.25 dividend, providing some room for further hikes. This could be the key rerating catalyst that many BBDC investors are looking for.
If we look instead at total investment income (i.e. before operating expenses) we see that it has been increasing nicely as we would expect in a rising short-term rate environment.
Systematic Income BDC Tool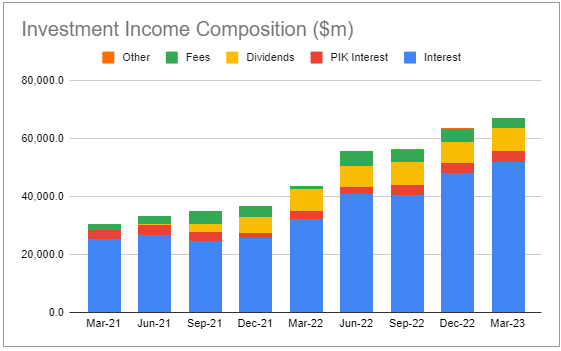
Management declared the same $0.25 dividend as they did for the first quarter. The company has outearned this dividend for 4 quarters in a row. Based on the trailing 4-quarter average of net income, dividend coverage is 114%.
Systematic Income BDC Tool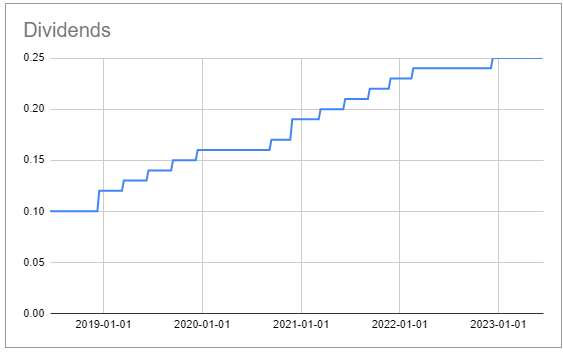
The NAV rose by 1.1%, primarily due to unrealized appreciation of the portfolio.
BBDC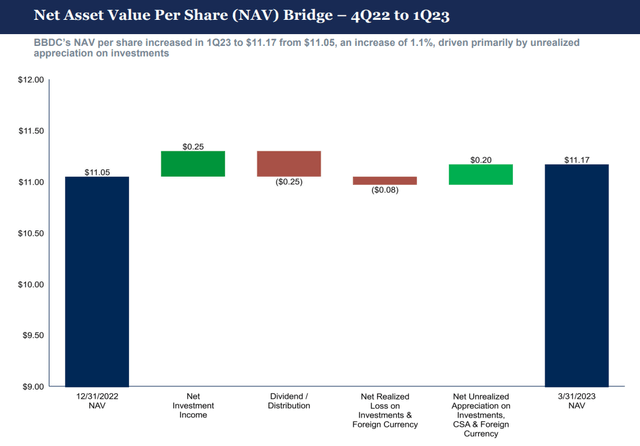
Management have indicated they are considering repurchasing shares given the large discount to book. Since the management call, the stock is up 7%, roughly in line with the rest of the sector, so it’s not clear whether the company will be satisfied with this result if they have not yet repurchased shares. The current authorization is for $30m of shares (about 3.5%) at prices below the NAV.
The company is also rotating out of its acquired legacy portfolios with $8m of combined sales and repayments during the quarter.
BBDC has made a new $45m investment in Rocade Holdings – a litigation finance platform which provides loans to law firms secured by the firms’ interests in award settlements. This is not just a vanilla investment. Rather the company views this as almost a joint venture with the added attraction of it being uncorrelated to the broader portfolio as well as internally diversified due to unrelated award settlements.
Income Dynamics
Net new investments came in at $91m. The company has been adding to its portfolio nearly every quarter. This should continue to support net income.
Systematic Income BDC Tool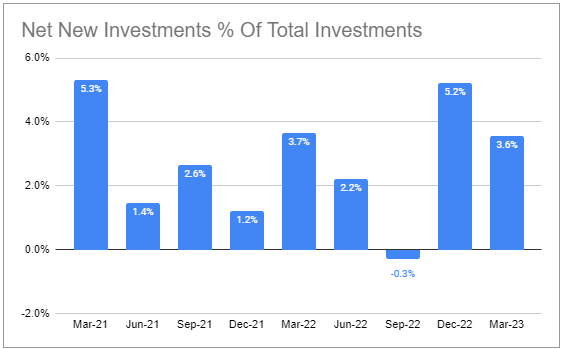
Net leverage rose to 1.19x – towards the top end of the 0.9-1.25x range.
Systematic Income BDC Tool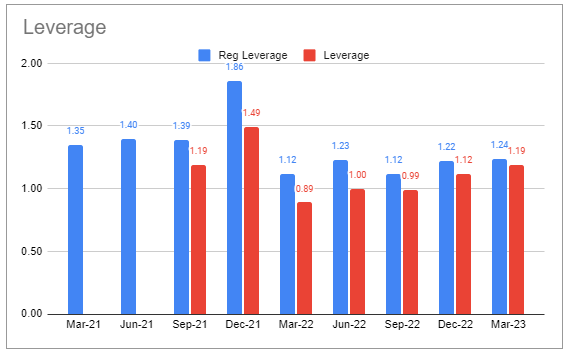
The company features a relatively shareholder-friendly fee structure of a reasonable management fee of 1.25% (below the 1.5% median) as well as a high hurdle of 8.25% for its incentive fee (versus a 7% median level). Both of these features create smaller net income headwinds relative to the average BDC.
Portfolio Quality
Non-accruals are fairly well-behaved at 1.1% on fair-value – below the sector average. Out of the 9 non-accrual investments, two were originated by BBDC with the rest coming from MVC and SIC acquired portfolios.
Systematic Income BDC Tool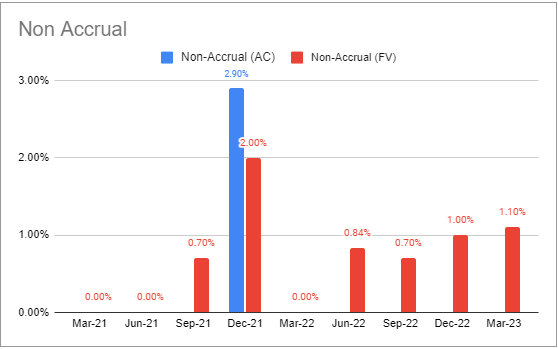
Apart from those two investments, the remaining acquired non-accruals are covered by the credit support agreement or CSA which is intended to offset losses in the acquired legacy portfolio with the manager retaining the downside. However, changes in the value of the CSA does not offset unrealized depreciation 1:1 in the normal course of operation as the value of the CSA is determined based on a longer-term view of potential outcomes which takes into account potential equity upside and other factors. This means there could be some noise in the NAV over time.
The CSA covers an amount of up to $23m for the MVC portfolio and up to $100m for the Sierra portfolio. The value of the CSA to the BDC is $58.7m which suggests that it expects significant downside in the portfolio which echoes the fact that marks are well below par in aggregate. So far, the portfolios have seen net unrealized appreciation.
PIK is slightly above the average level in the sector. Management have guided that they have little restructured PIK (i.e. loans originally underwritten as cash but amended to PIK) as borrowers continue to cope with higher base rates.
Systematic Income BDC Tool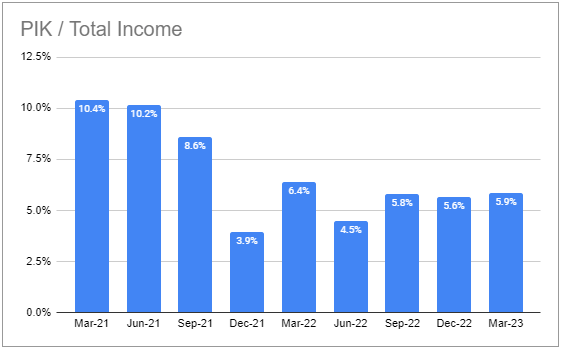
Over the past couple of years the company has had cumulative net realized losses though the overall figure is fairly small of just -0.2% or -0.1% per year.
Systematic Income BDC Tool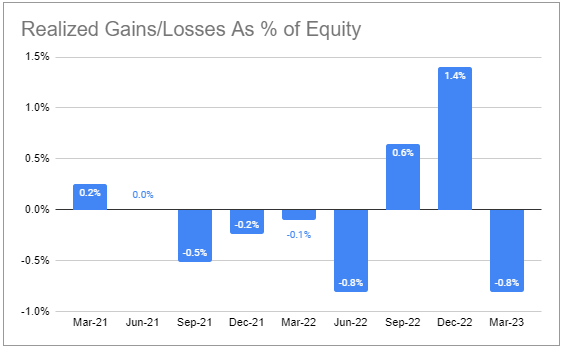
The company wrote up its $29.6m loan to Core Scientific to $15m from $11.1m in December. The company filed for bankruptcy late last year. Trinity Capital (TRIN) also increased the marks on its CORZ loan over Q1.
Valuation And Return Profile
Normally, we would compare BDC performance across a 5Y period as well as take a look at the individual trajectory. We don’t have a 5Y performance period for BDC so instead we take a look at a period starting at the end of 2018. By this metric BBDC is an underperformer, clocking in about 2.2% below the average BDC in our sample.
Systematic Income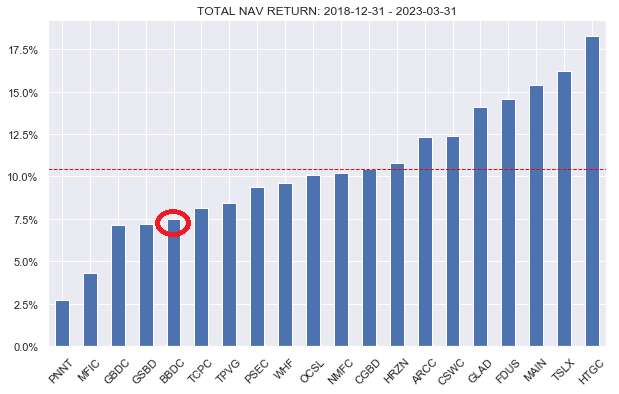
Taking a look at the “standard” periods we see that BBDC has underperformed over the past year and outperformed over the past 3 years. We put less weight on the 3Y numbers because the volatility around COVID makes the 3Y metric less reliable (i.e. many companies like BBDC fell harder in Q1-2020 but also bounced more in Q2-2020). If we include Q1-2020 BBDC moves back to underperformance.
Systematic Income CEF Tool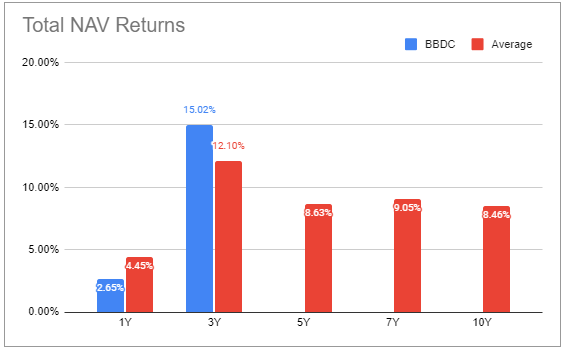
Looking at the trajectory of quarterly performance we see that BBDC has tended to underperform by more (yellow line falling below zero) and outperform by less (yellow line rising above zero).
Systematic Income CEF Tool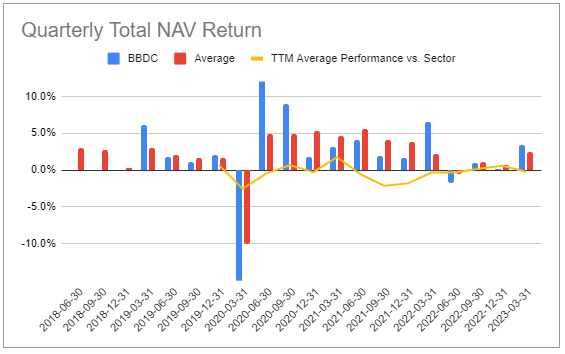
The company’s valuation has never been particularly strong. For a brief post-COVID period it traded at a valuation not far from the sector average however in late 2020 it started to revert to its weak longer-term profile.
Systematic Income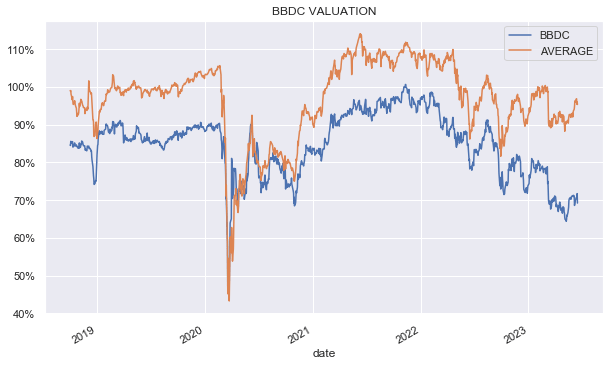
The following chart shows its relative valuation more clearly. Apart from the brief post-COVID period it has tended to trade at a valuation about 10-20% below the sector average. Most recently, it widened out even more to a valuation 26% below the sector average (69% vs. 95%).
Systematic Income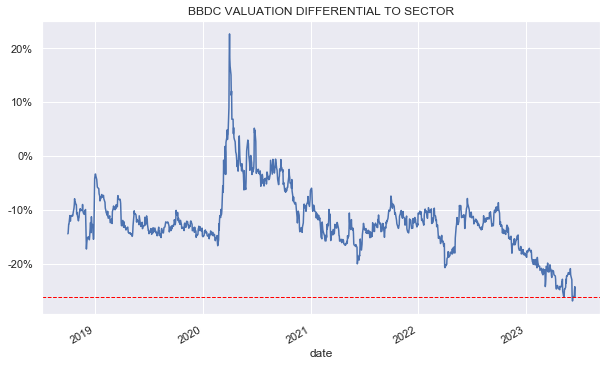
If we look at the company’s longer-term return against its valuation we see that it’s significantly cheaper than a number of other BDCs with returns of around 8% since the end of 2018. Arguably, GBDC is a special case here given its rights offering fiasco.
Systematic Income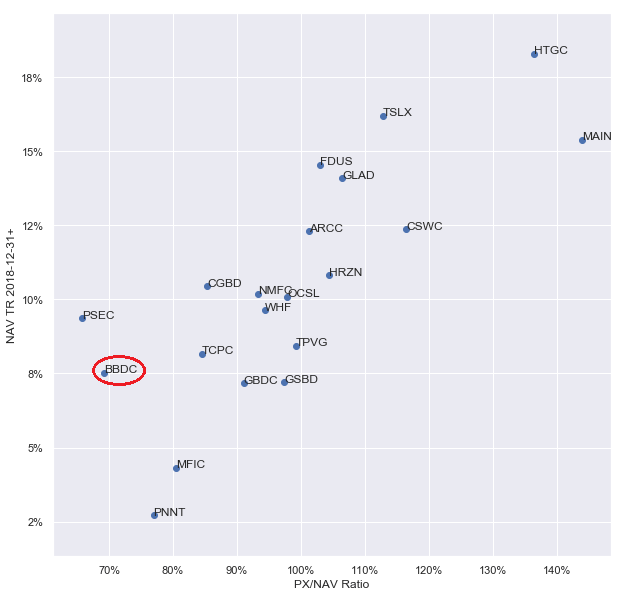
It’s always worth looking at returns over various periods. Relative to its longer-term performance, starting at the end of 2018 (the period for which we have the data), the company’s valuation is fair. This is because the valuation is below the average to a similar extent (i.e. by about 30% or 7.5% vs. 10.25%) that the company’s performance is below average. Its performance over the COVID period as well as over the past year exhibits a roughly similar level of underperformance.
All of this suggests that its valuation is not unreasonably cheap. Perhaps the best that can be said here is that BBDC is not cheap but rather, a number of other BDCs with a similar historic total NAV return are expensive. In other words, BBDC looks cheap not relative to the sector but relative to BDCs like TCPC, TPVG and GSBD.
Investors who view BBDC as cheap are implicitly taking the view that the company’s performance will improve relative to its history. Alternatively, the view is that BBDC valuation will move into rich territory just like valuations for BDCs with similar historic total NAV returns like GSBD and TPVG.
Stance and Takeaways
There are quite a few positives in the BBDC story. Non-accruals native to the BBDC portfolio are fairly low, indicating decent underwriting. Management appear to be putting more focus on portfolio construction and research. Q2 net income should see a significant boost as incentive fees fall to a lower level which could allow the company to raise the dividend. And a share repurchase program could support the stock in the medium term.
On the opposite side of the ledger we have a company that’s undergone large changes in management. It has also undertaken a number of legacy portfolios which, while they have some downside protection, are still taking attention away from organic growth. And, perhaps, most importantly, the company has delivered consistent underperformance relative to the sector where the level of underperformance vs. the sector is roughly in line with its level of valuation vs. the sector. Perhaps the best that can be said is that other BDCs with a similar level of return are expensive while BBDC is reasonably priced.
All of that said, we could easily see a pop in the price due to the positive factors discussed above. This could make it a compelling play for more tactical investors.
Read the full article here


