
ETF Characteristics And Track Record
The iShares MSCI UAE ETF (NASDAQ:UAE) with a listing history of over 9 years, and an AUM of $39m, offers coverage to 38 stocks that are keenly exposed to the Middle East’s second-largest economy. With a relatively paltry AUM of less than $40m, it’s understandable that spreads in this ticker are particularly poor; In fact, UAE’s 45-day average spread % stands at heightened levels of 0.37%; to contextualize this figure, do consider that it is over 12x the corresponding figure of the iShares Emerging Markets ETF.
As far as the income angle is concerned, the UAE ETF offers a decent enough figure of less than 3%, in line with the average if considering other ETF options that focus on comparable economies such as Egypt, Qatar, Saudi Arabia, and Egypt.
YCharts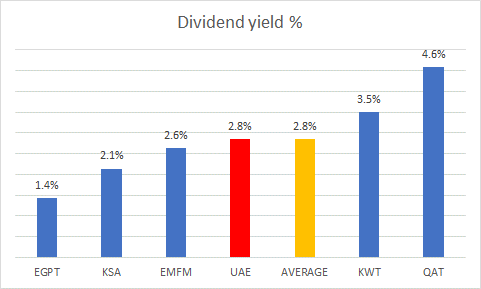
Investors should be aware that UAE has a history of churning its portfolio significantly on an annual basis; A couple of years back, the portfolio turnover ratio crossed 100%, and last year it stood at over 50%, implying that 1 in 2 stocks was rotated (for context, most ETFs typically only churn 1 in 3 stocks every year).
YCharts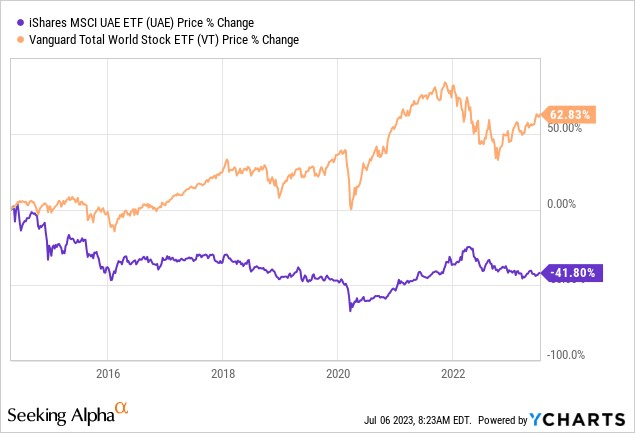
UAE also has a long track record of eroding wealth; since its listing date it has lost 41% of its value, and consequently grossly underperformed a portfolio of global stocks (the Vanguard Total World Stock ETF).
YCharts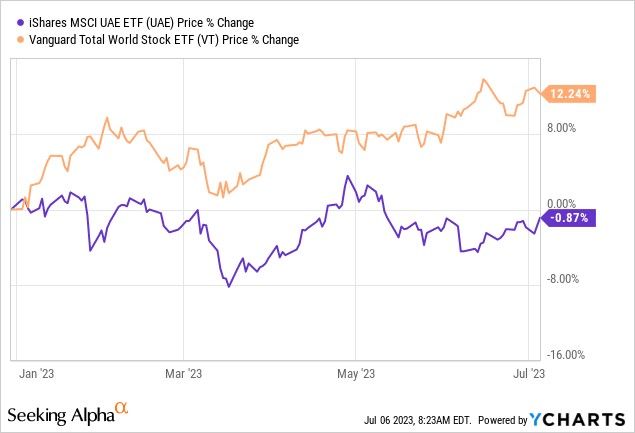
This year too, the performance has been unremarkable with UAE delivering flattish returns, even as VT has grown by 12%. However, we think H2 may prove to be a better period for UAE.
Macro Commentary
After a solid 2022, where real GDP growth came in at 7.9%, growth this year will understandably be a lot slower. Yet despite a much weaker growth threshold, investors should note that UAE will still likely be the fastest growing region in the GCC with an expected figure of 3.3% (40bps higher than the GCC terrain’s growth expectation).
Central Bank of The UAE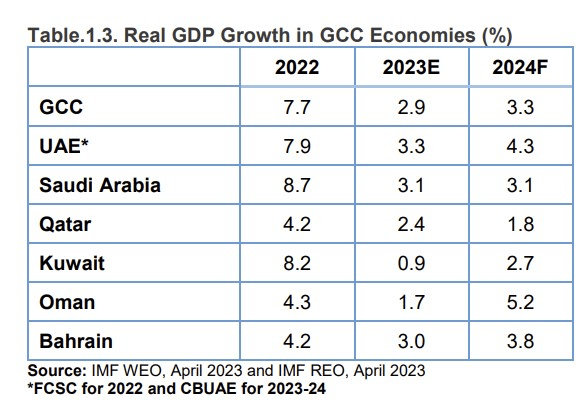
Last year, of course UAE was able to make hay while the sun shone and managed to produce 3.1m barrels per day on average; however, this year, oil-related GDP will come off in a big way with OPEC-induced production cuts taking out close to 150k barrels per day since May.
OPEC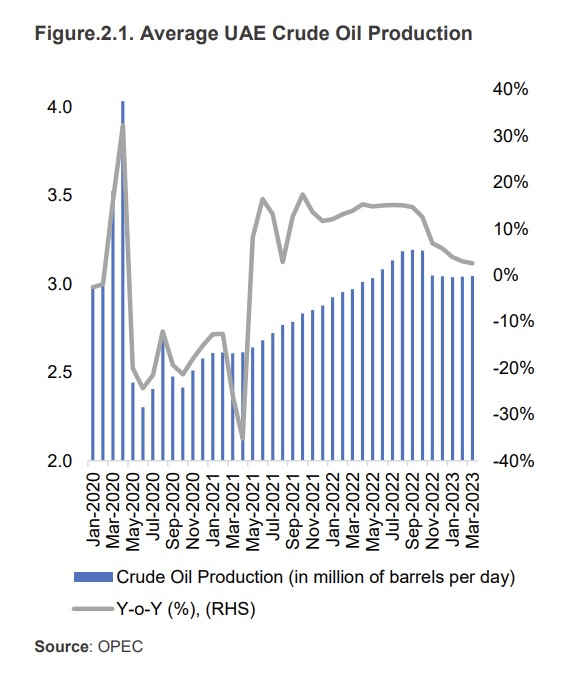
All in all, oil-related GDP which grew at a whopping 9.5% in FY22, will contract by -0.3% this year. We believe there was the risk of this falling by an even greater margin on account of further cuts announced by Saudi Arabia and Russia, but the latest reports suggest that the UAE finance ministry is unwilling to join the bandwagon.
Needless to say, the onus this year will likely be on the non-oil segment (including travel and tourism), and fortunately, growth there is still expected to be resilient enough (albeit not as strong as what was seen last year; expected growth of 4.5% vs 7.2% last year).
If the UAE ETF is to flourish, a lot could depend on how its banking stocks fare, as they account for the largest share of the portfolio at 40%. The central bank of UAE seems to take its cue from the US Fed reserve, and with rates poised to increase yet again, we think the net interest margin trajectory of UAE banks should remain in good shape.
So far, the steepening of rates hasn’t upended the asset quality of banks. Conversely, in Q1, the net NPL ratio actually trended lower to levels of 2.9%. We don’t believe this trend will persist for too long, but as things stand, banks there have already done well, with the PCR (Provision coverage ratio) recently crossing the 90% mark.
Central Bank of The UAE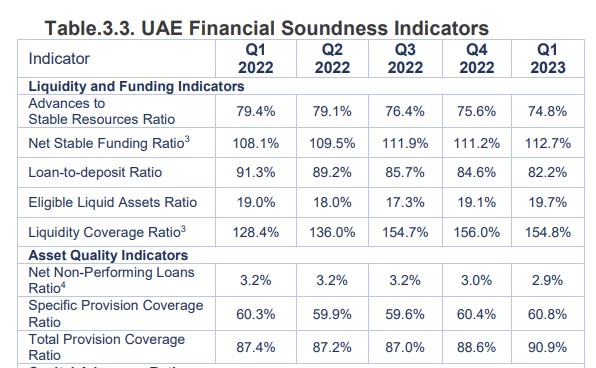
Under an increasing interest rate regime, loan growth would normally be expected to slow down, and we have seen that play out in Q1 (gross credit growth of only 3.5%) but investors should also recognize that the base effect of loan growth in H2-22 was already quite low, so these trends don’t necessarily have to persist in H2-23.
Closing Thoughts: Valuation & Technical Considerations
On the valuation front, UAE stocks currently appear to offer better value than what’s available in most other comparable regions. As per YCharts data, the constituents of UAE currently trade at 10x forward P/E (only the VanEck Vectors Egypt ETF is priced at a lower multiple), translating to a 17% discount over the average of the peerset.
YCharts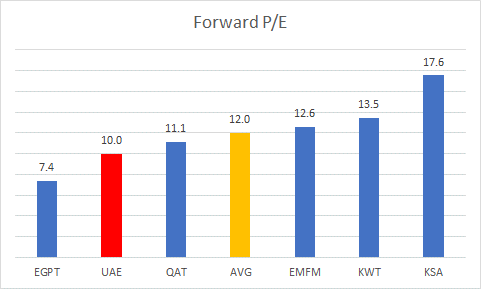
On the charts, we believe UAE looks in a much better place now, compared to where it was over a year ago.
UAE’s weekly chart shows that since April last year, the ETF had been trending lower in the shape of a falling wedge pattern. We saw an end to this pattern, when the UAE broke past the upper boundary of its wedge in early April 2023. After a couple more weeks of trending up, we’ve seen the ETF complete two pullback legs, and now it looks to be setting out for another leg higher by first re-testing the April highs.
Investing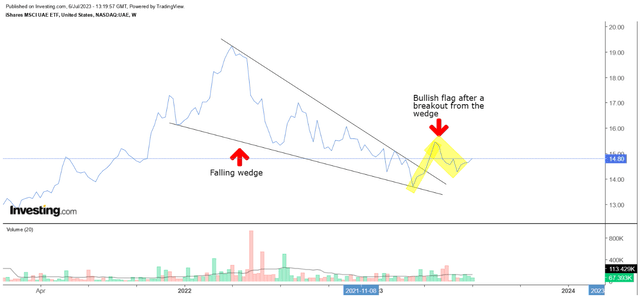
UAE may continue to benefit from bullish momentum as investors fishing for rotational opportunities across the globe could view this ETF as an ideal play. To elaborate on this, note that UAE’s relative strength versus stocks from across the globe (as represented by the VT ETF) is currently trading 36% below the mid-point of the long-term range and could be due a catch-up.
Stockcharts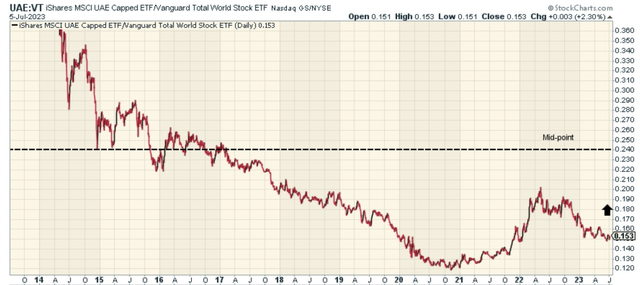
Read the full article here

