Thesis
TD SYNNEX Corporation’s (NYSE:SNX) Q2 2023 earnings reflect a robust, albeit not entirely rosy, financial performance. Despite missing expectations with an EPS of $2.43 and a revenue dip to $14.06 billion, a 7.91% year-on-year decrease, the tech solutions giant showcases significant resilience. In my article, I argue that despite some financial dips, TD SYNNEX’s strategic focus on high-growth technologies and its solid plans for Q3 and Q4 indicate potential for growth, offering a compelling narrative for investors.
Company Overview
TD SYNNEX Corporation resides at the heart of the information technology universe, acting as both a distributor and a comprehensive solutions aggregator. Their portfolio stretches wide, catering to an array of tech needs, from personal computing appliances and mobile technology to printers and their auxiliary components.
Equally compelling is TD SYNNEX’s embrace of contemporary data center technologies. Here, they channel their expertise into areas such as cloud computing, data security, storage options, networking solutions, and server technologies.
Yet, TD SYNNEX doesn’t simply stop at product provision. Their spectrum of services encompasses systems design, assembly, and stringent testing, coupled with the all-important aspect of logistics support. To enhance the customer experience, they offer end-to-end distribution and shipping solutions, positioning themselves as a provider of comprehensive logistics services.
And finally, public cloud solutions, online services, and a wealth of financing options are other niche areas where TD SYNNEX has developed specialization. Their clientele cuts across various sectors, serving resellers, retailers, system integrators, and those providing managed services.
SNX’s Bullish Q2 2023 Earnings Highlights
TD SYNNEX showcased a robust Q2 performance, exuding a vigorous cash flow spectrum and steady earnings, showcasing a non-GAAP EPS of $2.43 coupled with a brawny operational cash flow surpassing $700 million. Notwithstanding an underperformance in revenue in the Q2’s early stage due to the volatile demand spectrum across diverse technologies, the firm adeptly seized growth avenues in realms like data centers and cloud migration. Their assorted portfolio was a critical asset in capturing market share across burgeoning technology sectors in North America and Europe.
Globally, gross billings experienced a modest dip of 4% amounting to $18.7 billion, and net revenue faced a contraction of 7% ending at $14.1 billion, both gauged in constant currency. Nonetheless, the company evidenced growth in high-tech sectors such as AI, data, IoT, cloud, security, and hyperscale infrastructure. These segments collectively exhibited a moderate teens percentage growth on a YoY basis, constituting over a fifth of the gross billings for the quarter.
Non-GAAP gross profit was reported at $969 million, while the gross margin saw a 45 basis point uptick to 6.9%. This ascend can be traced back to the firm’s strategic pivot towards high-growth technologies and advanced solutions. Non-GAAP operating income receded by 5.6% to $376 million, and operating margin saw a minor elevation of 6 basis points to 2.7%. Non-GAAP EPS for the quarter contracted by 11% YoY, which would have been a shrinkage of 2% if higher interest expenses and foreign exchange translations were disregarded.
As Q2 concluded, TD SYNNEX held $852 million in cash and equivalents, juxtaposed with a debt burden of $4.1 billion. The firm sustained its investment-grade credit rating with a gross leverage ratio of 2.3 times and net leverage standing at 1.8 times. Inventories and accounts receivable witnessed a downtick in comparison to the preceding quarter, and net working capital contracted to $3.8 billion. Cash conversion cycle was recorded at 24 days, aligning with anticipations and following seasonal tendencies.
TD SYNNEX dispersed $93 million to shareholders through dividends and share buybacks in Q2 and authorized a dividend of $0.35 per common share. The firm hit its merger-related cost synergy objective ahead of time, bringing about $30 million in incremental savings and a cumulative $200 million. Further enhancements in their cost structure are on the cards, with an emphasis on curtailing SG&A expenses by around $50 million.
Projecting into Q3 and Q4, TD SYNNEX anticipates an upturn in the demand for products within the PC ecosystem. The forecast for Q3’s gross billings is gauged between $18 billion and $19.3 billion, and total revenue is predicted between $13.5 billion and $14.5 billion. The company foresees a modest market resurgence towards late Q3 and entering Q4, with revenue projected to experience an 8% sequential surge in Q4.
And finally, regarding capital allocation, TD SYNNEX returned $241 million to shareholders during the year’s first half and projects to augment that by nearly $100 million in the second half of 2023. This hearty capital return strategy resonates with their confidence in generating in excess of $1 billion in free cash flow for the fiscal year 2023.
Expectations
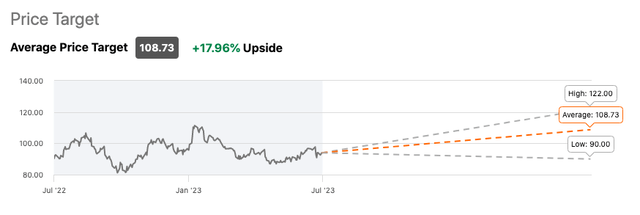
SNX is currently covered by 11 Wall Street analysts with a combined “buy” rating for the stock suggesting a +17.96% upside potential for the share price.
Seeking Alpha
Performance
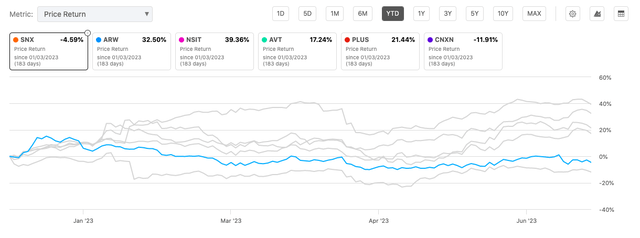
Relative to its peers, SNX is a notable laggard down -4.59% YTD.
Seeking Alpha
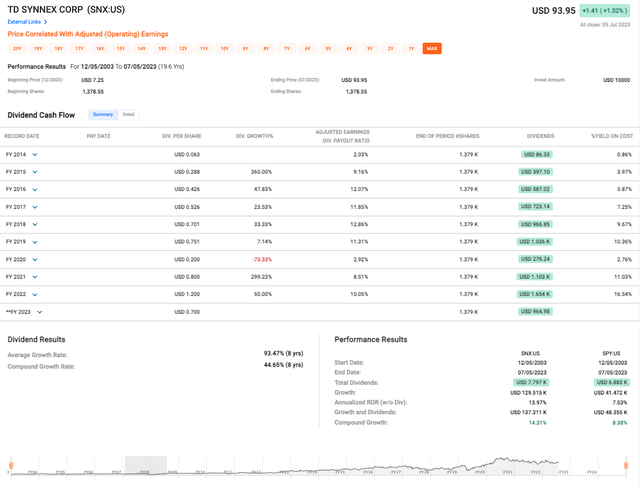
However, the bigger picture of TD SYNNEX’s 19.6 year performance from 2003-2023 speaks volumes of their success (see data below); showing a rise from their initial price of USD 7.25 all the way up to their share price of USD 93.95 at the time of this writing.
Fast Graphs
The devil is always in the details and in TD SYNNEX’s case, it lies in the dividends. Dividend growth has been impressive; over the last 8 years, average dividend growth rates averaged 93.47% and compound dividend growth rates 44.65% – incredible statistics which demonstrate how the company prioritizes returning cash back to shareholders (however, more on that in “Risks & Headwinds” below).
In comparison with the S&P 500 ETF Trust (SPY), TD SYNNEX outperforms in terms of total dividends and growth. Its annualized Rate of Return (ROR) without dividends stands at 13.97%, nearly double that of SPY at 7.53%. With dividends factored in, the compound growth rate remains superior at 14.31% versus SPY’s 8.38%.
Valuation
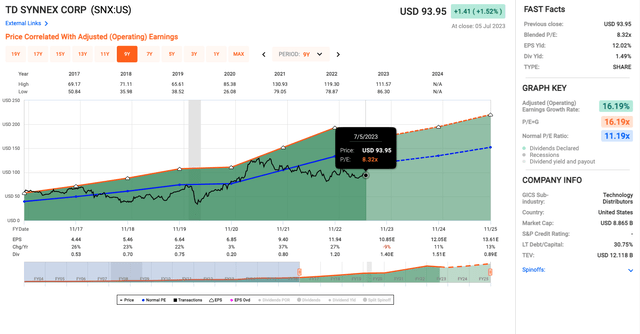
What initially grabbed my attention is the stock’s Blended P/E ratio of 8.32x (see chart below). This is significantly below the Normal P/E ratio of 11.19x. The current P/E ratio signals that the market may be undervaluing TD SYNNEX, especially given the historical earnings growth rate of 16.19% suggesting that the company is either overlooked or mispriced, presenting a potentially attractive entry point for value investors.
Fast Graphs
Additionally, TD SYNNEX has an adjusted (operating) earnings growth rate of 16.19%, a figure that matches its PEG (P/E = G) ratio. A company growing at this rate and with this ratio might be seen as priced just right for the growth you’re getting, but given the lower P/E ratio we discussed earlier, I’m left wondering whether this may present an opportunity for growth at a bargain.
Risks & Headwinds
Beginning with the dwindling demand for Endpoint Solutions, we can’t disregard the implications it holds for future revenue generation. According to management, customers, having recently escalated their capital investments, are now in a phase of investment digestion. As such, they appear less inclined to further invest in Endpoint Solutions. This declining demand may trigger a ripple effect on the company’s future revenue landscape, casting a shadow on their growth projections.
Examining the company’s fiscal anatomy more closely, the slowdown in sales materializes as a concern. The previous year’s corresponding period reveals a decrease in gross billings and net revenue worldwide, dipping by 4% and 7% respectively in constant currency terms. This trend doesn’t merely hint at a moderation in sales; rather, it may imply an impending slump.
The Q3 fiscal outlook echoes a similar tone of alarm. Projections indicate a further contraction of 7% in gross billings and an unsettling 10% decrease in total revenue YoY, adjusted for constant currency. This downward spiral is reflective of mounting challenges that the company needs to combat strategically and proactively.
The company’s bottom-line narrative also shows signs of concern. The non-GAAP net income and non-GAAP diluted EPS for the recent quarter have slipped by 11% YoY. The decline persists even after adjusting for higher interest expenses and FX translation, with a still significant 2% decrease. This income contraction suggests that the company’s earnings health could be at some risk of losing its vigor.
Despite a commendable cash position, TD SYNNEX bears the burden of a hefty $4.1 billion debt. Such a sizeable debt portfolio could potentially unlock numerous risk factors, jeopardizing the company’s financial stability.
Furthermore, despite the commendable gesture of returning $93 million to shareholders through dividends and share repurchases, the question arises about the sustainability of this strategy. If the downward revenue trend continues, the viability of maintaining such generous capital returns is threatened, which could strain investor relations.
Lastly, TD SYNNEX’s strategic plan to merge its two ERP systems into a single enterprise platform is a high-stakes game. While the potential cost benefits of this integration are indeed tempting, they come hand-in-hand with the peril of operational disruptions.
Final Takeaway
To summarize, given TD SYNNEX’s robust long-term performance, commitment to shareholder returns, and strong position in growing tech sectors, I’d rate the stock a “buy”. However, the recent underperformance and potential risks should be closely monitored. Despite the short-term challenges I just mentioned, its undervaluation and earnings growth suggest a promising long-term investment.
Read the full article here


