Introduction
France-based TotalEnergies SE (NYSE:TTE) released its Second-quarter 2023 earnings on July 27, 2023.
Note: I have followed TTE quarterly since 2017. This new article is a quarterly update of my article published on July 13, 2023.
1 – 2Q23 Results Snapshot
TotalEnergies reported a second-quarter 2023 adjusted net income of $1.99 per share ($4,956 million). It was down from the year-ago $3.75 realized last year ($9,796 million) due to declining commodity prices.
However, the cash from operations was up significantly in 2Q23 compared to the two preceding quarters, as shown below:
TTE Quarterly Cash from Operations History (Fun Trading)
The total revenues came in at $56.271 billion, down 24.7% from $74.774 billion in the year-ago quarter due mainly to lower commodity prices.
Second-quarter upstream equivalent production averaged 2,471K Boepd, down 9.75% from 2,738K Boepd realized last year. Those numbers exclude Novatek.
For the second quarter, liquids production averaged 1,571K Bopd, up 6% from the year-ago period. Quarterly gas production was 4,845K Cfpd, down 29% year-over-year due to lower gas production from Africa, the Asia Pacific, Europe, and America.
The production of the iGRP segment excluding Novatek (Integrated Gas, Renewables, and Power) was 438K Boepd compared to 462K Boepd in 2Q22.
Total acquisitions for 2Q23 were $482 million, and total divestments were $162 million.
Production is expected to be 2.5 M Boepd in 3Q23, and the company confirmed a total 2023 CapEx between $16 billion and $18 billion, with $5 billion for low-carbon energies.
2 – Investment Thesis
TotalEnergies SE continues to be one of the safest investments in the oil sector, especially regarding dividends. Dividends are secure and have been going up steadily for years without any interruption.
Also, TotalEnergies SE remains a large oil and gas producer, albeit shifting to renewables, representing a non-negligible rising part of its business model with about one-third of its 2023 CapEx, or $5 billion allocated to renewable and “green electricity generation”.
Thus, oil and gas prices remain the main component of TTE revenues, with renewable and green electricity growing in importance but still marginal. Brent price is down over 10% YoY, while NG (US only) is down a whopping 72%.
TTE 1-Year Chart Brent and NG Prices (Fun Trading StockCharts)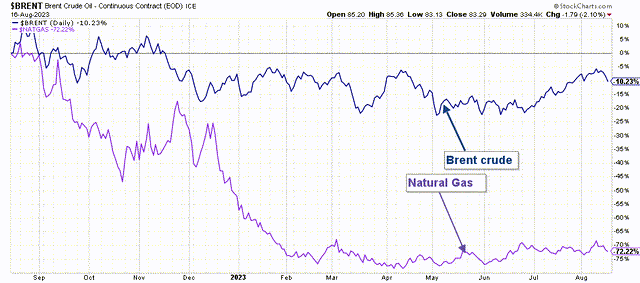
Thus, it is essential to trade short-term LIFO for about 40%-50% of your TTE holding and keep a long-term core position for a higher target. This dual strategy lets you take full advantage of the oil and gas sector’s high volatility and inherent cyclicity while enjoying an appealing dividend.
3 – Stock performance
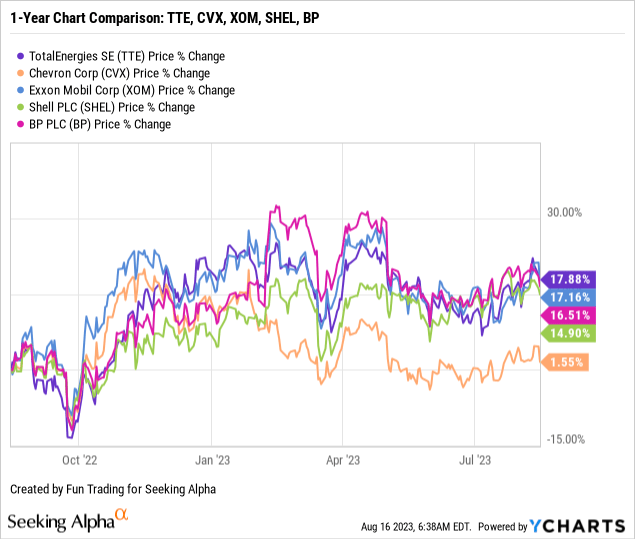
TotalEnergies has slightly outperformed the group, which includes Shell (SHEL), U.K.-based BP (BP), as well as US majors like Exxon Mobil (XOM) and Chevron Corp. (CVX).
TotalEnergies SE is up 18% on a one-year basis.
TotalEnergies: Balance Sheet and Production history ending in 2Q23: The Raw Numbers
Note: TTE is an American Deposit Receipt or ADR. The Foreign withholding taxes reduce the dividend paid to American investors is 12.8%. However, the foreign tax paid can be deducted from your income tax. Sometimes, your broker charges you 25%, but I believe it may be a mistake. Ask your Financial Adviser about your case.
| TotalEnergies SE | 2Q22 | 3Q22 | 4Q22 | 1Q23 | 2Q23 |
| Total Revenues in $ Billion | 74.77 | 69.04 | 68.58 | 62.60 | 56.27 |
| Total Revenues (minus excise tax) in $ Billion | 70.45 | 64.96 | 63.95 | 58.23 | 51.53 |
| Net income in $ Billion | 5.69 | 6.63 | 3.26 | 5.56 | 4.09 |
| EBITDA $ Billion | 14.98 | 16.49 | 12.99 | 13.60 | 10.56 |
| EPS diluted in $/share | 2.16 | 2.56 | 1.26 | 2.21 | 1.64 |
| Cash from operating activities in $ Billion | 16.28 | 17.85 | 5.62 | 5.13 | 9.90 |
| Capital Expenditures in $ Billion | 5.15 | 2.99 | 4.10 | 4.97 | 3.87 |
| Free Cash Flow in $ Billion | 11.13 | 14.86 | 1.52 | 0.165 | 6.03 |
| Total Cash $ Billion | 40.71 | 47.63 | 41.77 | 35.52 | 32.30 |
| Long-term Debt in $ Billion | 62.87 | 61.82 | 60.77 | 60.80 | 55.97 |
| Dividend per share in €/sh (including tax 12.8%) |
0.69€ |
0.69€ |
0.69€ + 1.00€ Special dividend |
0.74€ |
0.74€ |
| Shares outstanding (diluted) in Billion | 2.611 | 2.588 | 2.510 | 2.492 | 2.478 |
| Oil Production | 2Q22 | 3Q22 | 4Q22 | 1Q23 | 2Q23 |
| Oil Equivalent Production in K Boepd | 2,738 | 2,669 | 2,812 | 2,524 | 2,471 |
| Americas Production in K Boepd | 420 | 449 | 442 | 441 | 443 |
| Average price liquids $/Boe | 102.9 | 93.6 | 80.6 | 73.4 | 72.0 |
| Average gas price $/Mbtu | 11.01 | 16.83 | 12.74 | 8.89 | 5.98 |
Source: Company filings and Fun Trading.
Analysis: Balance sheet and production discussion
1 – Total revenues were $56.271 billion (including excise tax) in 2Q23
TTE Quarterly Revenues History (Fun Trading)
TotalEnergies’ revenues came in at $56.271 billion (including the excise taxes) or $51.534 billion net, significantly down from the $74.774 billion generated in the year-ago quarter. The company indicated a profit of $1.64 per diluted share and adjusted net income was $4.96 billion in 2Q23 compared to $9.80 billion in 2Q22.
Net earnings were $4,088 million, down from $5,692 million in 2Q22.
TotalEnergies reported an adjusted EBITDA of $11,105 million in 2Q23, down from $18,137 million in 2Q22.
2 – Trailing 12-month free cash flow (“ttm”) was $22.58 billion with $6.03 billion in 2Q23
TTE Quarterly Free Cash Flow History (Fun Trading)
TotalEnergies trailing 12-month free cash flow is now $22.578 billion, with $6.03 billion realized for 2Q23.
Cash flow from operating activities at the first quarter-end was $9,900 million, down from $16.284 billion in the year-ago period.
TTE paid a quarterly dividend of €0.74 per share in the second quarter of 2023, or a dividend yield of 4.46% before French Tax automatic withdrawal (12.8% or 25%).
The company intends to buy back up to $2 billion worth of TTE shares in 3Q23.
3 – Net debt was $23.67 billion as of the end of June 2023
TTE Quarterly Cash versus Debt History (Fun Trading)
As of June 30, 2023, cash and cash equivalents were $32,297 million compared with $40,711 million in 2Q22.
The debt-to-equity ratio is now 0.4923, according to YCharts. Net debt to capital was 11.1% at the end of the second quarter of 2023 compared with 11.5% at the end of the first quarter of 2023.
Using another method, TTE indicates a net debt of $14.536 billion ($12.972 billion in 2Q22).
Note: I have done a more general calculation from the LT Debt, including current minus total cash, which is more comparable with other oil majors.
4 – Details: TTE operates four different segments
TTE Quarterly Operating Income per Region 2Q22 versus 2Q23 (Fun Trading)
4.1 – Exploration & Production (Upstream)
The operating gain was $2,349 million, down significantly from $4,719 million last year.
4.2 – Integrated Gas, Renewable, and Power
Operating income was $1,780 million, down from $2,555 million in 2Q22.
4.3 – Refining and Chemicals
Operating income was $1,004 million in 2Q23, down from $2,760 million in the year-ago quarter.
4.4 – Marketing and Services
Operating income was $449 million, down slightly from $466 million in 2Q22.
5 – 2Q22 Oil Equivalent Production up to 2,471K Boepd from 2,738K Boepd last year.
TTE Quarterly Oil Equivalent Production History (Fun Trading)
Total hydrocarbon production during the second quarter of 2023 averaged 2,471K Boepd, down from 2,738K Boepd in the same quarter the previous year. In 1Q23, production was 2,524K Boepd.
This quarter’s average realized liquids prices were $72.0, down 30% from the year-ago price. NG prices were $5.98, down from $11.01 per thousand British thermal units last year.
TTE Quarterly Liquid and NG Price History (Fun Trading)
Upstream output comes primarily from Europe and the Middle East. TotalEnergies SE has a small production from the Americas.
TTE 2Q23 Production per Region (Fun Trading)
Liquid production averaged 1,571K Bopd for the second quarter, and quarterly gas production was 4,845K cfpd.
Technical Analysis and Commentary
TTE TA Chart Short-term (Fun Trading StockCharts)
TTE forms an ascending channel pattern with resistance at $64.1 and support at $60.8.
Ascending channel patterns or rising channels are short-term bullish in that a stock moves higher within an ascending channel, but these patterns often form within longer-term downtrends as continuation patterns. The ascending channel pattern is often followed by lower prices.
TTE is highly correlated to oil and gas prices which have been quite bullish lately but seem to be reaching a strong resistance and a possible retracement as China fears and rate hikes counter a tight US supply.
Oil prices settled lower on Wednesday despite a large drawdown in U.S. crude stocks as investors weighed worries about China’s embattled economy against expectations of tighter supply in the United States.
Thus, the trading strategy is to sell about 40%-50% of your position LIFO between $63.75 and $64.50 with possible higher resistance at $65 and wait for a retracement between $61 and $60 with potential lower support at $59.2.
Warning: The TA chart must be updated frequently to be relevant. It is what I am doing in my stock tracker. The chart above has a possible validity of about a week. Remember, the TA chart is a tool only to help you adopt the right strategy. It is not a way to foresee the future. No one and nothing can.
Read the full article here

