2023 New year saving money and financial planning concept.
Introduction:
I started my personal new portfolio around November 15, 2022, with a modest initial funding of $60,000. I added another $68,000 by January 31, 2023. I further increased the funding gradually, and as of today, I have a total of $803,000 in the investment account. The majority of the additions occurred towards the end of March and in April. The source of this investable cash is my past savings until retirement elsewhere in the world. I have now shifted to the USA, as we intend to continue our retired lives there. The intention of these investments is to generate a continuous stream of cash to take care of our expenses year after year for the rest of our lives and then continue to generate cash for our two sons and their families, who are all living in the USA. We do not have any IRA or ROTH accounts, and all these funds are deployed in taxable brokerage accounts only. I have 40+ years of personal experience in managing stock investments, and I will continue that going forward, except that this is a new brokerage account and the investments initiated are fresh in the USA. I intend to share this new investment experience as my portfolio story. This is my second article in this series to show what I have done until now, while the first or initial one can be reached by clicking “My 2023 Picks For My Portfolio“. I will be coming out with further articles in this series as and when a major milestone is reached or as a periodic report of what I have done or as to why I choose a specific stock to be part of my portfolio or why a stock appears attractive to me at a specific price. Besides all these, I will come out sharing some aspects of portfolio building or related thoughts. One such aspect will be shared towards the end of this article as well. I will be happy if this sharing of experience helps someone else to act or think in a similar way and/or build their future financial independence. In the process of building my sons’ portfolios, I have written many articles in SA in the past. These can be seen by clicking my profile and reaching out to my past articles. I would like to draw specific attention to one of my earlier articles with the title “My Perennial Income Portfolio“, which can be accessed by clicking on the title.
The stocks go up or down in a cyclical manner along with economic growth or recession. The growth stocks offer a low dividend yield relative to inflation and I cannot be certain if today’s growth stocks will remain so forever. The high dividend yield stocks may not grow their dividends fast enough to beat inflation. The so-called dividend growth stocks yield relatively low. It is difficult to find a good dividend growth stock that also yields high. There is no sure way to buy and believe that we have picked the right stocks at the right time. It is a challenge to balance investments. The following is how I proceed with these challenges.
Stock Selection Process:
a. I plan to choose 50 or 60 different stocks and diversify the investments. That way, in the long run, if any one or a few of my investments fail to meet my expectations, there will again be a few that could perform better than my expectations, and the portfolio as a collection will take care of my needs.
b. I make sure that the dividend income from each of these investments does not exceed the 1 week’s cash requirement of my average expenses. That way, a 50 to 60 stocks portfolio will take care of my total annual expenses or cash requirements in a diversified way.
c. The stocks selected in general should have a good corporate credit rating by S&P, Moody’s, or Fitch agencies. There are many reasons why some companies choose not to seek a credit rating, including cost savings, infrequent bond issuance, and investors’ familiarity with the brand. I might still choose some companies without such ratings, but with more attention to their debt levels or interest coverage aspects.
d. The dividend distributions expected should grow with inflation so that the money value of dividends collected year after year does not lose its buying power. The list of companies selected will have a mix of different dividend growth rates and yields. In general, the projected dividend flows year after year should reasonably grow with inflation.
e. The selected stocks should have a satisfactory dividend payout or dividend growth history, in addition to paying within reasonable payout ratios relative to their earnings.
Those who want to know the methodology can refer to an earlier article I wrote on this site under the title “My Perennial Income Portfolio,” which appeared in May 2020. The selection process is almost identical, while the actual ticker selected depends on market prices.
My Methodology For Investing:
People who follow me know that I indulge in a slow accumulation of shares for the long term while also indulging in short-term trading activities. By this, the trade gains accumulated against each ticker are used as a moat for my portfolio, and the gains adjusted net cash invested in each ticker is considered my cash flow cost on these. The goal is to make enough trade gains and the ‘cash flow cost’ of retained stocks and earn a double digit dividend yield going forward. While this is not quickly achievable in the short run, consistent trade activities in all price ranges and bull or bear markets will help achieve the goal. In the long run, such slow accumulation tends to build the entire portfolio allocation, generating a double digit dividend income going forward or a substantially higher yield with yield growth behind each selection, so that over time the dividend yield on my net cash invested exceeds my expectations. It is needless to say that such a high perennial dividend yield / income will beat the average stock market returns that can be expected, but most important is that it takes care of my cash flow needs year after year. For that reason, the dividend income is not included in arriving at the cash flow cost, as this is intended for expenses and tax dues. Time will tell if this is achieved.
My Actual Portfolio Details To Date:
The current position of my holdings as of April 30, 2023 is shown in the table below:
Investment Bucket Holdings (Author’s Personal Data)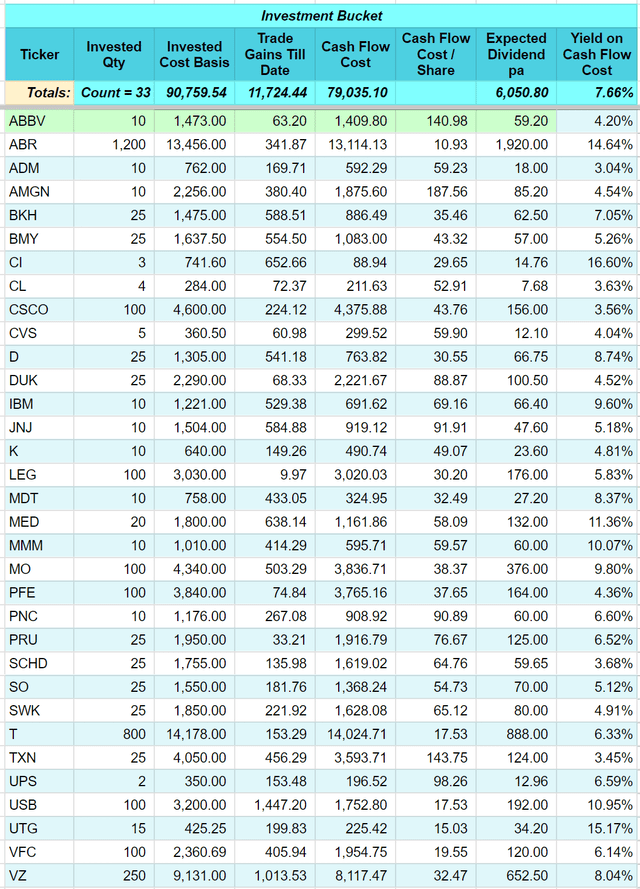
Note ‘Cash Flow Cost’ is the actual cost less the trade gains made on the same ticker. Dividend income on the same is not netted, since I intend to keep that for taxes and my expenses.
In addition to the positions specified above, I also traded and made trade gains during this period, but do not hold shares for the long term in the following tickers. My intention is to hold some positions in these tickers going forward.
Other Trade Gains (Author’s Personal Data)
Thus, the total trade gains achieved amount to $11,724.44 + $2,143.09 = $13,867.53.
The net cash flow cost of the portfolio held amounts to a net investment of $76,892.01 (Cost Basis $90,759.54 less Trade Gains $13,867.53). This is expected to generate a dividend income of $6,050.80 pa at current dividend rates with a forward overall yield of 7.87% pa. Further trade activities and dividend growth are expected to increase this yield rate going forward.
I also earned a dividend and brokerage interest income of $2,234.45 during this period, which I retained for tax obligations. This dividend and other income are not adjusted in the net cash flow cost.
In the process of trading and building long-term picks, many times prices slide down. I buy newer low-cost buys, and they go to replace the earlier higher-cost buys, while the higher-cost buys get moved into the trade bucket. These become baggage temporarily and will remain in the trade bucket until they get sold at a price higher than the cost basis or at an intended sell price later on. The current Trade Bucket holdings are listed below.
Trade Bucket Holdings (Author’s Personal Data)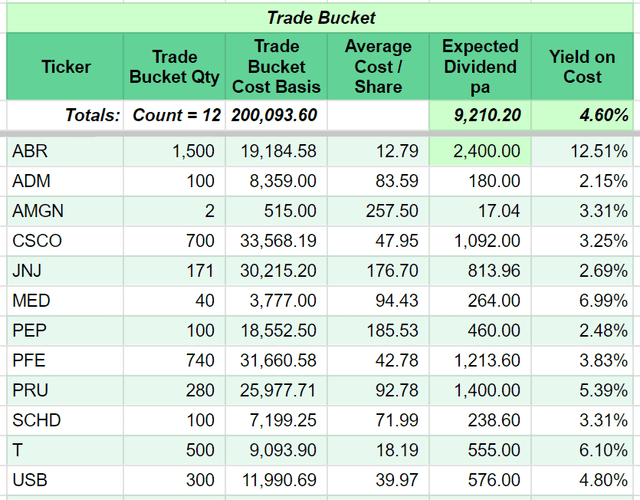
The Portfolio Diversification:
The total of trade bucket holdings and investment bucket holdings should not exceed a certain percentage of total funding to avoid unexpected outsized losses just in case the prices do not move as expected. Each one can decide their risk tolerance by setting a limit. Generally, I do not like to exceed 5% of total funding as exposure in any single stock at any given time. I would like to limit long-term holdings in any single share to 2.5% of total funds allocated for long-term investment. Temporarily, they might exceed this limit to some extent, but the gains made over time should bring the net cash flow invested down to the 2.5% limit. The portfolio should ultimately be populated with 50 to 60 different stocks. These are approximate limits for a full position. The current total picture is given below:
Portfolio Holdings (Author’s Data)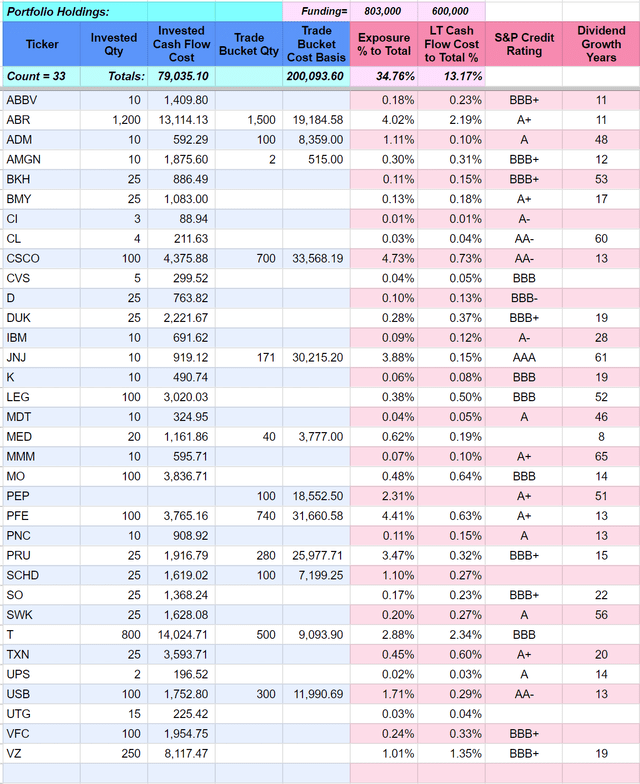
The brokerage account is funded at $803,000 and is considered the total for the trade bucket plus the investment bucket funding. I intend $600,000 (approximately 75% of the total) to ultimately become the total funding for the investment bucket, while the remaining will remain as a trade bucket. These totals will change as I go forward, but they are an accurate intended figure based on my current funding of the brokerage account. The difference of $203,000 is intended to continue the process of trading activity to help add in the investment bucket. I have invested 13.17% of the investment allocation, while I have exposed 34.76% of the total available cash. If the market remains crashed and the trade bucket needs to be held to see the light of its day for exit, the expected dividend pa from the trade bucket holdings at $9,210.20 plus the dividend expected from investment bucket holdings at $6,050.80 will make a total of $15,261 as expected annual dividend income from the funds invested. This works out to an average overall dividend yield of 5.47%.
The portfolio’s sector-wise diversity can be seen in the following table:
Portfolio Sector Diversity (Author’s Data)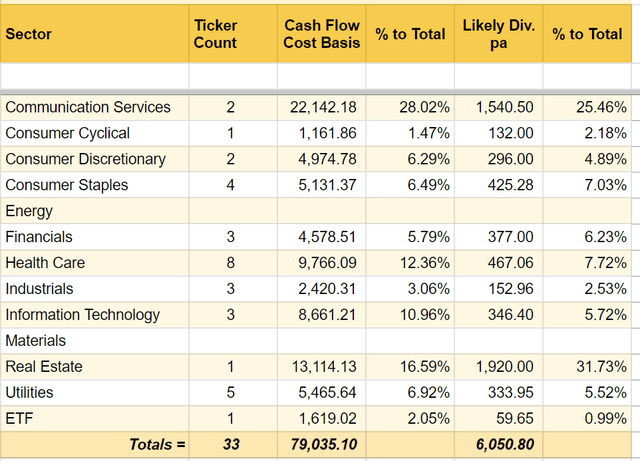
I have included only the intended long-term positions of the portfolio in the sector-wise analysis to avoid trade bucket holdings distorting the picture. An average of $500+ pm is expected out of these holdings.
Dividend Ratings by Seeking Alpha:
Seeking Alpha premium subscribers can view the dividend grades assigned to tickers. The dividend grades assigned to the tickers in my portfolio are listed below:
Seeking Alpha Dividend Grades (Seeking Alpha as on 29-April-2023)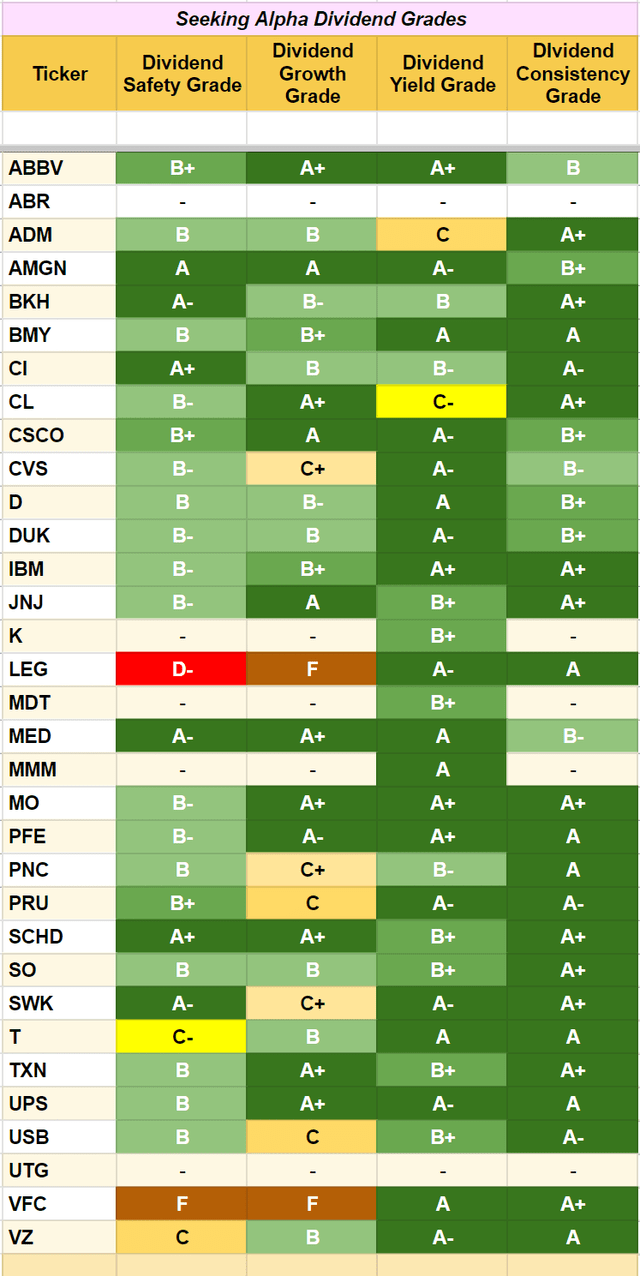
They also provide other ratings such as Factor Grade and Quant rankings amidst other features. Readers are encouraged to explore them as part of their diligence before investing in specific shares. These grades and rankings keep changing with time as the market keeps moving.
Other Trade Activities:
With that spare cash, I also indulge in option trades where I sell naked puts at my desired buy levels. These are not listed here, but help add to the trade gains. Generally, I write cash secured put options with short expiry durations where the funds tied will generate a 10% pa rate or get assigned at much lower prices. Generally, such premiums are high during earnings season. I sometimes write similar call options against the trade bucket quantity, if such strike prices are above my cost of buy and can generate a meaningful return while I wait to exit in net gains. These option positions are not listed here. However, if all the cash secured puts are getting assigned and my portfolio ends up having these, the top 10 total exposures of such assignments plus trade bucket and investment bucket holdings can be summarized with a pie chart.
Top10 Exposures (Author’s Data)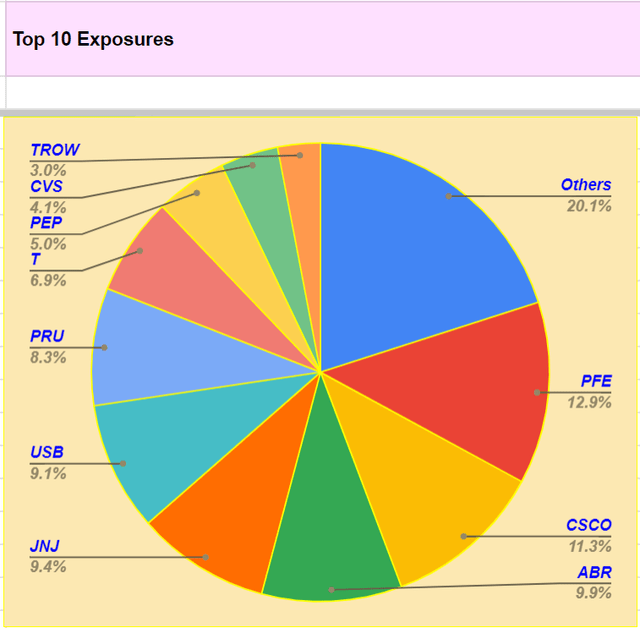
The main reason I provide this information is that the option PUTs are not blindly done, and the total portfolio exposure shall be properly evaluated before anyone following me should keep it in mind.
This Article’s Special Sharing Of Thoughts:
I mentioned in the early part of the article that I would share some aspects or thoughts on portfolio building. At this juncture of (a) some financial / banking stocks going through difficult times, (b) interest rate hikes affected by the Fed to tame inflation, (c) supply chain and cost inflation taking place in the economy, and such issues, I want to emphasize the “credit quality” of the stocks in which we invest as an important aspect of portfolio building. I generally peruse the Moody’s or S&P credit ratings of the investment choices. Special attention is drawn to what the credit ratings mean in general for those readers who are not familiar with them. The following table conveys it quickly.
Credit Ratings (Author’s Data)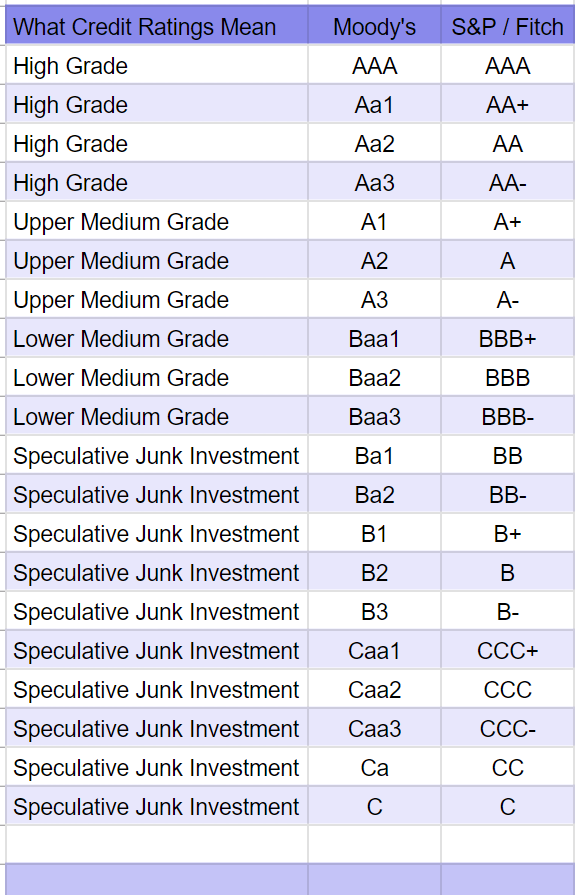
The stocks that have the ‘A’ letter in their ratings have very sound financial stability and the ability to withstand economic variances. Since many investors go after these stocks as their safe haven stocks to hold in their portfolio, the dividend yield from these choices will be limited. When the yields go relatively higher, it is time to buy these to full position in the portfolio. This does not mean the ‘B’ letter in the credit ratings part indicates a risky buy. The electric utilities, for example, have a huge debt profile as part of their investments to take care of future needs to replace the fossil fuel based system. For this reason, their dividend yields are relatively higher. They also have a wide moat of monopoly in each of their areas of operation, aided by a rate increase process in line with cost. The people using the utilities cannot seek alternative choices and switch overnight. This business moat makes them good choices even if their credit rating is most often BBB+, BBB, or BBB-. However, I still prefer the stocks with BBB+ or BBB among these choices over those with BBB- which is just a notch away from junk investments. The reason to avoid BBB- is that any credit rating downgrade will make their borrowings very expensive and quickly drive them into the junk investment category. Just like how portfolio distribution is done among various business sectors of the economy, I would like to see a healthy portfolio credit composition as part of portfolio building. If ever a BBB rated company gets downgraded to BBB-, it is time to pay more attention to those specific ones. It is not in any immediate threat to needing a substitution in the portfolio. We can easily find a substitute to replace it with a higher quality one over time when market prices give a replacement chance.
In my above portfolio listing, I have given only the S&P ratings, while I actually use both S&P and Moody’s credit ratings. The distribution of my portfolio stock exposures (trade bucket and investment bucket) is as given below:
My Portfolio Credit Ratings (Author’s Data)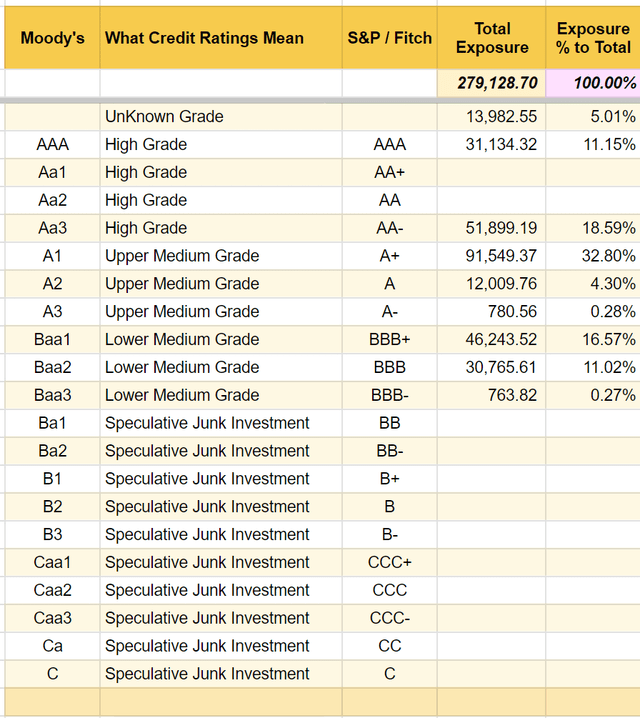
The majority of my portfolio picks have A ratings. The B rated ones belong to the utility sector, which are safe haven stocks. One can notice that the unknown grade does have an exposure of 5.01%, and these are either ETFs or debt-free companies. There is one BBB- rated company, Dominion Energy Inc. (utility), with a small exposure of 0.27% of total funds invested.
Overall, A* related companies have an exposure of 23.33%, B* rated companies 9.69%, unrated companies 1.75%, and the remaining 65%+ stay as brokerage account balances out of the total portfolio inclusive of trade bucket holdings. Thus, I am confident in the overall credit quality of my portfolio holdings.
I will come out and share more of my thoughts in the next article in this series.
Personal Disclosure:
I am not a qualified investment advisor. Use your own decision to follow or emulate similar practices. Seeking Alpha provides an excellent medium to discuss your portfolio and experience. You can share your experience the same way I do. It helps to listen to other readers’ views and hence a chance to rectify your portfolio. This could also educate someone else on achieving financial freedom. Thanks for reading my portfolio story. I wish you happy investing.
Read the full article here


