
MidCap Financial (NASDAQ:MFIC), a business development corporation (BDC), the former Apollo, finally achieved a monumental level of stability, finally. Under a former name Apollo, the company gave investors a roller-coaster ride with scary downs and short-lived ups. We know, our multiple year investment created an unprecedented level of worry. The company installed Howard T. Widra as CEO in May of 2018, with plans to point the company in a completely different direction. Prior, the model invested in sector based entities such as energy, aircraft, etc. Before that, it was something else. Volatility stated earlier was nauseating. Management defined its new direction using these words, “Our Investment strategy primarily focuses on investing in senior secured middle market loans sourced by MidCap Financial, a leading middle market lender with a long and successful track record.” Adding to this concept, the investment and debt payment structure floats almost seamlessly in unison during periods of rising or falling rates. There is a slight upside bias under increasing rates. The 1st lien investment strategy is just that, the best of the best premium 1st liens. This allows the business to safely operate at higher than most leverages. This clever model was supposed to produce a unique level of stability. It finally arrived.
We have owned, followed and written about either Apollo or MidCap for a very long time. Our last article on Seeking Alpha, MidCap Financial Investment: Pay Attention To The New Financial Face Of MidCap, announced a majority transition from the old to the new resulting in expected consistency. Our interest now turns to proof of concept through results and accessing possible increases in dividends. Should we mount the camera on the stabilizer and head out for some pictures? Would you join us carrying an open mind in addition to the stabilizer?
The Quarter in Review
For the June quarter, MidCap reported:
- $0.44 in NAVII with a dividend declared at $0.38.
- Net Asset Value (NAV) per share of $15.20, an increase of $0.02 quarter over quarter.
- Leverage of 1.45, in targeted range.
- 92% of the portfolio, “primarily of first lien top-of-the-capital-structure.”
- Well diversified by borrower and industry.
- Merx represented only 8% of the total NAV.
- Slow investment activity from marketplace stresses.
- Yields on new investments of 12.5%.
Solid results continues. Last quarter, NAVII equaled $0.45 with NAV essentially unchanged.
A Look Ahead At Dividends
In the call’s prepared remarks, management noted:
[W]e are well-positioned to generate net investment income of excess of this dividend level. We believe our portfolio will continue to earn above the current dividend in a normalized rate environment. Our Board and management team continue to evaluate potential dividend increases versus retaining earnings.”
During the question and answer, Melissa Wedel, of J.P. Morgan, asked for more detail concerning dividend increases. Widra answered:
We also have both requirements, obviously, to pay out a certain amount of income, as well as a desire, obviously, to return to the shareholders the — some excess return. And so, the answer is, if you did this over a longer period of time and we were out-earning what is our core dividend, $0.06-$0.07 a share each quarter, as were the last two quarters, there’s sort of room for both.
But it’s a year — it’s effectively a decision, I would say as much as we — the thing that sort of has been decided is the decision that we will make at the end of the year, . . . .”
With management focused on increased dividends and a decision at the end of the year, the next logical question is how much? To better answer the question, a set of tables contained in a previous article, MidCap Financial Investment: A High-Yield Lower-Risk Investment, follows.
From the article, MidCap Financial Investment: A High-Yield Lower-Risk Investment, is copy of the included table with the June results added.
| Excess Earnings | Sept. 20 | Dec. 20 | March 21 | June 21 | Sept. 21 * | Dec. 21 | March 22 | June 22 |
| NAVII | $0.43 | $0.43 | $0.39 | $0.39 | $0.33 | $0.35 | $0.42 | $0.37 |
| Dividend | $0.36 | $0.36 | $0.36 | $0.36 | $0.36 | $0.36 | $0.36 | $0.32 |
| Difference | +$0.07 | +$0.07 | +$0.03 | +$0.03 | -$0.03 | -$0.01 | +$0.06 | +$0.05 |
We continue with an additional table for the September through June quarters.
| Excess Earnings | Sept. 22 | Dec. 22 | March 23 | June 23 |
| NII * | $0.35 | $0.43 | $0.45 | $0.44 |
| Dividend | $0.37 | $0.38 | $0.38 | $0.38 |
| Difference | -$0.02 | +$0.05 | +$0.07 | +$0.06 |
* In the September quarter, management ceased its suspension of the 20% management fee.
The company has been earning more than the dividend for a long-time minus a few quarters. Results for the last three quarters show a consistent deviation at $0.06. The law requires a 90% return to investors or pay taxes. At earnings of $0.44, the required distribution must be $0.40 or $0.02 higher than the current rate. Management could decide on an even higher increase at $0.06. In the past during some periods, Apollo did distribute all of the earnings. Our belief is that management will increase it by 5% – 10% starting with the December report in February of next year. At prices of approximately $14, the current yield equals approximately 11%.
NAV Stability
A second critical parameter describing stock evaluation is NAV. A short table shows, MidCaps NAV over the past year.
Over the past year, the NAV dropped from the middle $15s to the lower $15s. This measurement reflects more than performance changes; it also includes natural degradation from significant interest rate increases, rather than from the quality of the investments.
Stock Chart
Included next is a chart of MidCap made using TradeStation Securities.
TradeStation Securities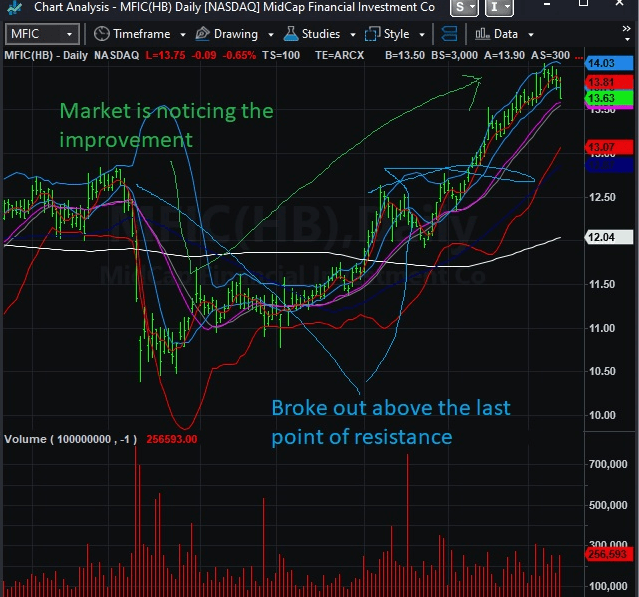
The market is beginning to understand the value of the new model employed with the increases in price. Notice the breakout above $12.5. Yet, the price is still significantly lower than the NAV and with its current yield of 11%, valuation remains cheap.
Risks & Investment Summary
Risks include significant changes in performance from economic slowdowns, if one happens. Also, within the model, earnings risk remains slightly biased lower under lower interest rates. Our view on lower interest rates includes a rational discussion about future pricing for crude oil and fossil fuel products. With structural issues in place pointing directly at higher pricing, inflation isn’t under or near under control. We linked one of many articles discussing some of the issues determining prices.
With yields and what appears to be stable performance MidCap is a buy in the $14 or lower price range. Our view is based on stock charts shown above. Management added the hand grip to the phone a few years ago. It just took time for the shaking to subside. Buying at the current price or lower could be a lucrative long-term investment while getting paid.
Read the full article here

