
Most international ex-U.S. exchange-traded funds focusing on the developed world have relatively standard country mixes as they offer Japan- and UK-heavy portfolios. For ETFs that attempt to mix developed and emerging market exposure but exclude the U.S., overreliance on Japanese and UK equities is again a permanent problem, with the iShares Core MSCI Total International Stock ETF’s (IXUS) example worth mentioning.
The IXUS website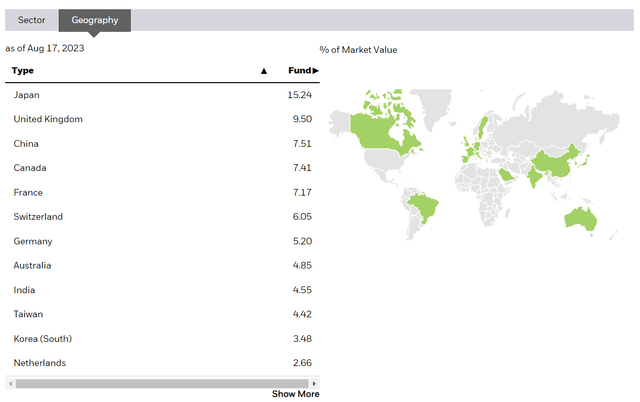
In theory, these almost identical country mixes and, inevitably, overweening exposure to the yen and pound sterling might be the hidden source of consistent underperformance of international ETFs, including those focusing on value stocks, which I have discussed multiple times in my articles, so perhaps a pickier, more flexible, and more complex approach to country selection and weighting could unlock value in foreign equities and help to escape that underperformance impasse.
To answer that question, a nice fund to review today is the Cambria Global Value ETF (BATS:GVAL). Incepted in March 2014, GVAL was initially managed passively, tracking the Cambria Global Value Index. The prospectus says that on 1 July 2020, the investment objective and strategy were changed, with the fund being actively managed thereafter.
As described in the fact sheet, GVAL is actively casting about the global equity universe for promising names worth buying into using “a composite of cyclically adjusted price ratios.” The initial universe encompasses 45 developed and emerging markets. The top quarter of the most inexpensive markets is identified using “Cambria’s proprietary long-term valuation metrics based on relative and absolute valuation.” In the next step, the 10 cheapest stocks from the group of the key 30 with the largest market caps within each country are selected using the composite aggregating “traditional metrics such as trailing P/E, P/B, P/S, P/FCF, and EV/EBITDA.” The composite might include other metrics. The goal is to allocate similar weights to all the components.
Importantly, the expense ratio of 70 bps reflects the active, highly sophisticated approach at the nucleus of GVAL’s investment process. Unfortunately, fees are also one of the reasons for GVAL’s tepid past performance, as we will discuss shortly.
It is worth noting that before the strategy change, GVAL used similar principles but wrapped in a passive form, so I believe the performance since its inception but prior to July 2020 should not be ignored. Here, it is worth providing an excerpt from the strategy description available in the fact sheet as of June 30, 2018, which I downloaded using the Wayback Machine:
The Cambria Global Value ETF seeks investment results that closely correspond to the price and yield performance, before fees and expenses, of the Cambria Global Value Index. The Index begins with a universe of 45 countries, located in developed and emerging markets. The Index then selects the top 25% cheapest country stock markets as measured by Cambria’s proprietary long term valuation metrics, similar to the CAPE ratio. Cambria then uses a valuation composite across traditional metrics such as trailing P/E, P/B, P/S, P/FCF, and EV/EBITDA to select the 10 most undervalued stocks out of the top 30 largest stocks by market capitalization within each country. The Index only selects liquid stocks with market capitalizations over $200 million, and is comprised of approximately 120 companies.
What is GVAL’s portfolio at this juncture? As of August 17, 2023, the product of its maximalist value strategy is a portfolio of 106 stocks, with the major holding (aside from the cash position, which accounted for 4.49%) being Warsaw-quoted Orlen S.A. (OTC:PSKOF) (Warsaw ticker PKN), an energy heavyweight trading with a phenomenally low P/S of 0.2x. Prague-quoted Moneta Money Bank AS (Prague ticker MONET) comes second, with 2.36% weight; overall, financials are GVAL’s dominant sector, with a 33.3% weight as of June 30.
With such a meticulous stock selection process, GVAL has a unique opinion on how to balance country exposure, with the current version of the portfolio overweight in Austrian (9.54%) and Italian (9.5%) equities and the smallest group being Hong Kong-quoted names (7.35%); the holdings dataset also shows two Russian companies, but with market values of zero or almost zero.
The following table shows GVAL’s currency exposures:
| Currency | Country | Code in the dataset | % |
| Brazilian Real | Brazil | BZ | 8.5% |
| Czech Koruna | Czech Republic | CP | 8.1% |
| Euro | Austria | AV | 9.5% |
| Euro | Italy | IM | 9.5% |
| Euro | Spain | SM | 9.3% |
| Hong Kong Dollar | Hong Kong | HK | 7.4% |
| Chilean Peso | Chile | CI | 9.3% |
| Pound Sterling | UK | LN | 7.6% |
| Malaysian Ringgit | Malaysia | MK | 7.6% |
| Singapore Dollar | Singapore | SP | 9.3% |
| Polish Zloty | Poland | PW | 9.4% |
Created by the author using the holdings data from the fund
GVAL succeeded in creating a unique country blend, but did its effort to select the most attractively valued names bear fruit? It certainly did. For example, Portfolio Visualizer shows the ETF’s P/E at 6.02x. The fact sheet as of June 30 mentioned a P/E of 5.69x. At the same time, the iShares MSCI EAFE Value ETF (EFV), which is supposed to represent the performance of EAFE (Europe, Australia, Asia, and the Far East) companies exhibiting value characteristics, comes with a 9.8x ratio.
However, a broader context is obviously needed. Below, I have compiled P/Es for ETFs representing markets present in the GVAL portfolio. Alas, I am not aware of a U.S. ETF with pure Czech Republic exposure; most likely, it does not exist. For modeling purposes, let us assume a theoretical Czech allocation would have a Price/Earnings metric similar to Poland.
| Country | ETF | Ticker | P/E |
| Austria | iShares MSCI Austria ETF | (EWO) | 6.21 |
| Brazil | iShares MSCI Brazil ETF | (EWZ) | 5.01 |
| Czech Republic | N/A | N/A | 6.52 |
| Chile | iShares MSCI Chile ETF | (ECH) | 5.17 |
| China | iShares MSCI China ETF | (MCHI) | 12.65 |
| Hong Kong | iShares MSCI Hong Kong ETF | (EWH) | 16.01 |
| Italy | iShares MSCI Italy ETF | (EWI) | 10.09 |
| Malaysia | iShares MSCI Malaysia ETF | (EWM) | 13.7 |
| Poland | iShares MSCI Poland ETF | (EPOL) | 6.52 |
| Singapore | iShares MSCI Singapore ETF | (EWS) | 11.58 |
| Spain | iShares MSCI Spain ETF | (EWP) | 10.46 |
| UK | iShares MSCI United Kingdom ETF | (EWU) | 11.51 |
Created using data from the above-mentioned iShares ETFs
Regarding HK and China ETFs, a few GVAL holdings with an HK code in the dataset can be found in the EWH portfolio but not in MCHI (like CK Hutchison Holdings (OTCPK:CKHUF)), and vice versa (like Geely Automobile (OTCPK:GELYF)). So in a scenario with all the above-mentioned funds weighted in the exact proportions the respective countries have in GVAL, the weighted-average P/E would stand at 8.89x (with MCHI included) or 9.15x (with EWH). This clearly supports the hypothesis of the GVAL portfolio’s relative inexpensiveness.
Unique Country Mix Is Not A Panacea
The pivotal question of today’s article is whether uniqueness in country selection approaches could be a cure for the value style’s perennial underperformance. Unfortunately, it turns out that this is not a panacea. Let us look at the April 2014-July 2023 data to elaborate on that. The funds selected for comparison are IXUS, EFV, the iShares Core S&P 500 ETF (IVV), and the iShares MSCI ACWI ex U.S. ETF (ACWX).
| Portfolio | GVAL | IVV | IXUS | EFV | ACWX |
| Initial Balance | $10,000 | $10,000 | $10,000 | $10,000 | $10,000 |
| Final Balance | $11,146 | $29,129 | $14,539 | $12,795 | $14,147 |
| CAGR | 1.17% | 12.14% | 4.09% | 2.68% | 3.79% |
| Stdev | 20.07% | 15.15% | 14.98% | 16.43% | 14.94% |
| Best Year | 29.50% | 31.25% | 28.14% | 21.25% | 27.22% |
| Worst Year | -22.29% | -18.16% | -16.45% | -14.66% | -16.04% |
| Max. Drawdown | -41.09% | -23.93% | -28.33% | -33.18% | -28.31% |
| Sharpe Ratio | 0.1 | 0.76 | 0.27 | 0.18 | 0.25 |
| Sortino Ratio | 0.15 | 1.17 | 0.39 | 0.25 | 0.36 |
| Market Correlation | 0.72 | 1 | 0.87 | 0.8 | 0.86 |
Created using data from Portfolio Visualizer
In the group, GVAL has the weakest annualized total return, the highest standard deviation, and the steepest maximum drawdown. For better context, the next table compares GVAL’s and IVV’s monthly and annual total returns. As it can be seen, the Cambria ETF outperformed the S&P 500 ETF in 2016, 2017, and 2022; it was especially successful amid the 2022 bear market. However, GVAL still delivered an annualized return 10.4x lower than IVV.
Created using data from Portfolio Visualizer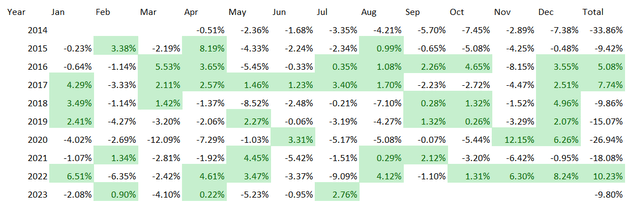
Investor Takeaway
GVAL offers an interesting view on global value investing, providing significant exposure to equities that other international ETFs have zero or close to zero allocations to. Alas, uniqueness does not immediately beget outperformance. At the same time, hefty expenses clearly dent long-term returns. So, while acknowledging GVAL might surprise to the upside amid the value rotation/U.S. tech correction, I assign the fund a Hold rating today.
Read the full article here

