
Quick Introduction to Business Development Companies
Business development companies (“BDCs”) invest shareholder capital in privately-owned, small- and medium-sized U.S. companies generating income from secured loans and capital gains from equity positions, much like venture capital or private equity funds. Anyone can invest in BDCs as they’re public companies traded on major stock exchanges.
BDC Buzz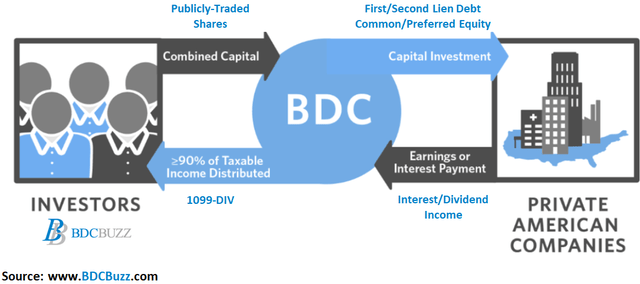
The BDCs in the chart below account for around 90% of the total assets and market capitalization for the sector. Over the two months, we discussed the portfolio credit quality and/or dividend coverage for most of them including Ares Capital (ARCC), FS KKR Capital (FSK), Blue Owl Capital (OBDC), Prospect Capital (PSEC), Goldman Sachs BDC (GSBD), Oaktree Specialty Lending (OCSL), New Mountain Finance (NMFC), Hercules Capital (HTGC), Sixth Street Specialty Lending (TSLX), PennantPark Floating Rate Capital (PFLT), PennantPark Investment (PNNT), BlackRock TCP Capital (TCPC), Gladstone Investment (GAIN), Gladstone Capital (GLAD), Monroe Capital (MRCC), Trinity Capital (TRIN), and TriplePoint Venture Growth (TPVG) in the following articles:
BDC Buzz & SEC Filings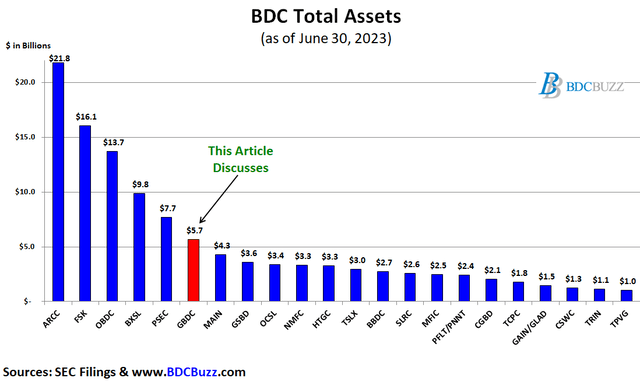
This article discusses Golub Capital (NASDAQ:GBDC) which is a “boring” lower-return BDC mostly for risk-averse investors. Before the markets opened on Aug. 8, we sent out a “Buy” recommendation discussing the recent reduction in management fees driving increased dividends paid to shareholders, as discussed below. Please note that the stock was trading at $14.10 at the time compared to the current $14.78.
Many BDCs have investment grade (“IG”) bonds/notes for lower-risk investors building a balanced 60/40 portfolio (composed of 60% to 70% stocks/equities and 30% to 40% bonds or other fixed-income offerings).
GBDC has three bonds (CUSIPs: 38173MAA0, 38173MAB8, and 38173MAC6) with investment-grade ratings by S&P, Moody’s, and Fitch which currently have yield-to-maturities over 7%. These bonds were previously overpriced, but prices have declined and are now at attractive levels as discussed last month in “Introduction To BDC Google Sheets.”
The following chart shows the recent decline in price for its bond due March 2027 with a current yield-to-maturity of over 7.4%:
FINRA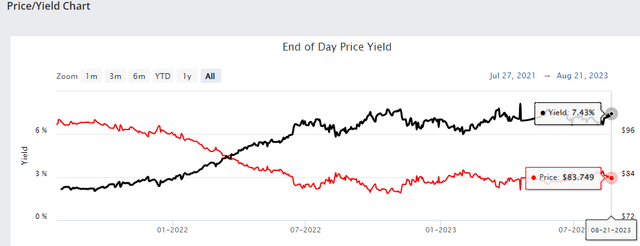
As mentioned below, the Asset Coverage and Interest Expense Coverage ratios are important indicators of the bond issuer’s ability to repay its debt. Higher coverage ratios indicate a lower risk of default and will be discussed in an upcoming article.
BDC Expense and Return Ratios
Each quarter, we assess changes to BDC expense and return ratios. There are many factors to consider, including the credit quality of the overall portfolio compared with dividend returns. Ideally, higher-risk BDCs would pay higher returns, but that’s not always the case for the reasons discussed in this below. The following are the key factors driving the ability of BDCs to deliver returns to shareholders:
- Operating/Management Expense Ratios – BDCs with lower operating expenses can pay higher returns relative to NAV per share and the amount of income from portfolio investments.
- Portfolio Yields – BDCs with higher risk should be able to deliver higher returns through increased portfolio yields (from higher-risk assets).
- Interest Expense Ratios – BDCs with lower borrowing expenses can pay higher returns. It’s important to note that BDCs with safer portfolios typically have lower borrowing rates because of the quality of collateral (assets).
- Asset Coverage Ratios – BDCs with lower leverage (higher asset coverage ratios) have the capacity for higher portfolio growth, driving higher earnings, without the need to issue additional equity.
- Portfolio Credit Quality – Maintaining portfolio credit quality is critical to delivering returns to shareholders and will be discussed in the updated Deep Dive Projection reports for each BDC, taking into account the recently reported results.
Operating Cost as a Percentage of Available Income
The last line in the projected financials (included in the Deep Dive Projection reports for each BDC) shows “Operating Cost as a Percentage of Available Income” which measures operating, management, and incentive fees compared to available income. BDCs with lower operating expenses can pay higher amounts to shareholders without investing in riskier assets.
- “Available Income” is total income less interest expense from borrowings and is the amount of income that is available to pay operating expenses and shareholder distributions.
Some BDCs have been temporarily waiving fees or have fee agreements that include a total return hurdle (taking into account capital losses), resulting in lower cost ratios, as discussed next.
For example, TPVG has not been paying incentive fees over the last four quarters due to continued portfolio credit issues, as discussed in many previous reports. If the company paid the full incentive fee over the last two quarters, dividend coverage would have been closer to 105% to 106%. Please note that I sold my position in TPVG in December 2022, mostly related to having a higher amount of investments considered watch list, as discussed in the recent article “Venture Debt Opportunity Yielding 13% To 14% For Your Portfolio: HTGC or TPVG?” linked above.
The following table shows the impact on its dividend coverage and its expense ratios (average increases from 24.3% to 39.3%) if the company paid the full incentive fees:
BDC Buzz & SEC Filings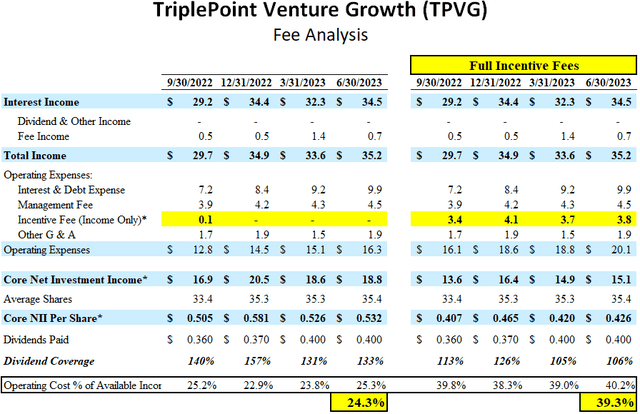
Earlier this month, GBDC announced a shareholder-friendly move, reducing its base management fee from 1.375% to 1.000% which will likely drive an additional 0.70% of ROE.
GBDC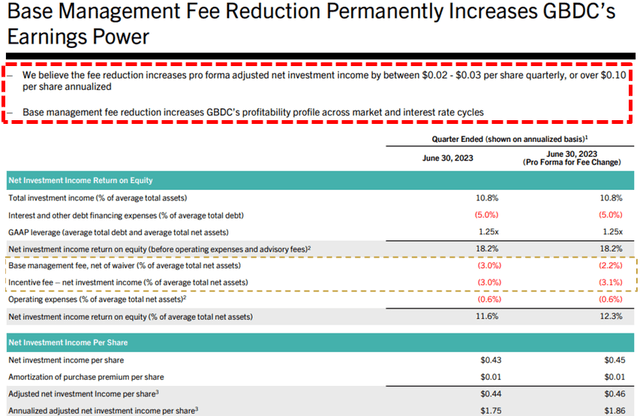
GBDC now has one of the best fee agreements in the sector with the lowest base management fee combined with the highest hurdle rate at 8.00%, and a cumulative “total return” hurdle or “look back” provision when calculating income incentive fees to protect shareholders from capital losses. I would like to see other BDCs join this group of lower fee structures that would encourage larger institutional investors to sector driving higher multiples and returns for current shareholders.
GBDC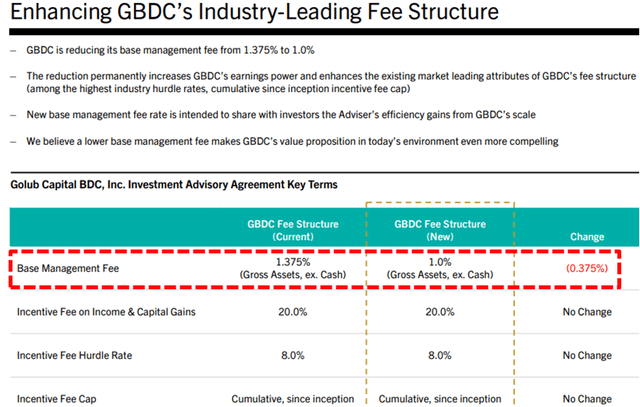
After taking into account the reduced base management fee (and impact to incentive fees) the expense ratio declines to 33.0% which is lower than most BDCs as shown in the comparison tables at the end of this article.
Also, the reduced fees add around $0.025 per share to quarterly earnings and was confirmed by management on the recent call:
Pro forma for the management fee reduction, GBDC’s adjusted NII increases by between $0.02 and $0.03 per share on a quarterly basis or over $0.10 per share on an annualized basis. Now the exact impact of the fee change is going to depend on a number of assumptions. But one way to interpret this analysis is that the lower management fee rate increases GBDC’s expected profitability book today and its average level of profitability across various market and interest rate cycles.
BDC Buzz & SEC Filings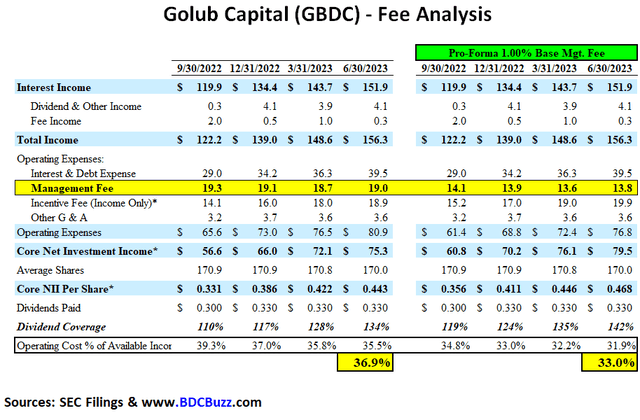
The continued over-earning of the previous dividend combined with the lower fee structure resulted in an increase of its regular quarterly dividend from $0.33 to $0.37 per share as predicted in my previous best-case projections.
The Board increased GBDC’s base dividend by over 12% to $0.37 per share. We believe this change is appropriate in light of GBDC’s enhanced profitability. The new base dividend is well covered by GBDC’s adjusted NII and was assessed in the context of our objective to remain a stable and growing NAV over time.
GBDC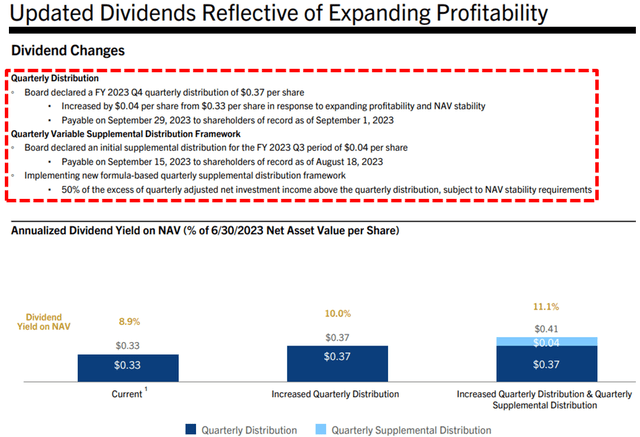
Also, similar to many other BDCs discussed in the articles linked above, GBDC has adopted a variable portion of its dividend policy to pay out the excess earnings as portfolio yields remain higher.
The Board approved a supplemental distribution that was based on the variable supplemental distribution framework that GBDC expects to implement going forward. The goal of this framework is to give shareholders a clear line of sight into how we plan to balance the likelihood that GBDC will continue to generate excess income, all else equal, on the one hand, with our focus on NAV stability and resilience on the other hand. In short, the variable supplemental distribution framework will propose supplemental distributions paid quarterly in arrears based on 50% of the amount by which quarterly adjusted NII exceeds the regular quarterly distribution, subject to NAV stability requirements and the Board’s discretion, oversight and approval. For fiscal Q3, the supplemental distribution amount is $0.04 per share payable in September.
GBDC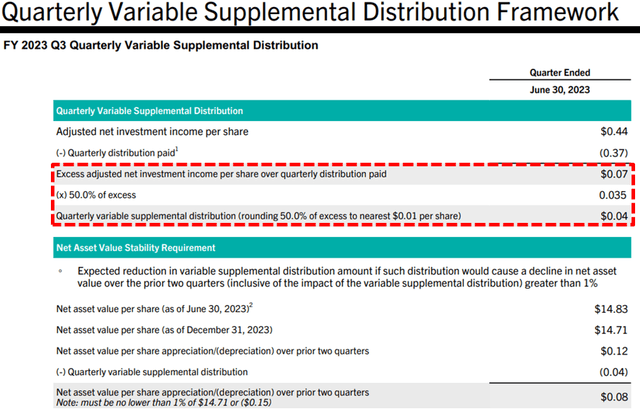
BDC Valuations
There are very specific reasons for the prices that BDCs trade driving higher and lower dividend yields mostly related to portfolio credit quality and dividend coverage potential (not necessarily historical coverage). BDCs with higher-quality credit platforms and management typically have higher-quality portfolios and investors pay higher prices. This drives higher multiples to NAV and lower yields.
BDC Buzz & SEC Filings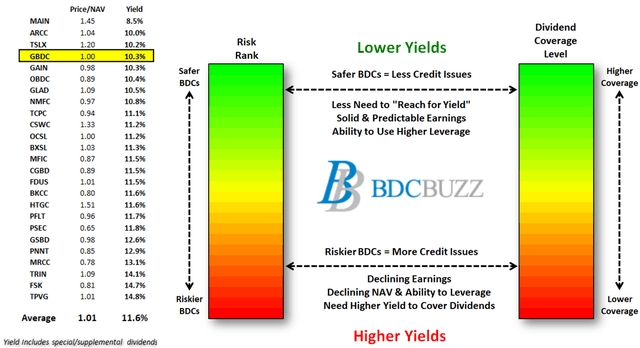
The following table shows the average operating cost% for each BDC over the last four quarters, with examples for MAIN and PSEC as well as the adjusted ratios for GBDC, GSBD, FSK, and TPVG. Please note that PSEC has not reported June 30, 2023, results yet.
As shown below, the recent reduction in GBDC’s fees will significantly improve its cost ratio relative to the others:
BDC Buzz & SEC Filings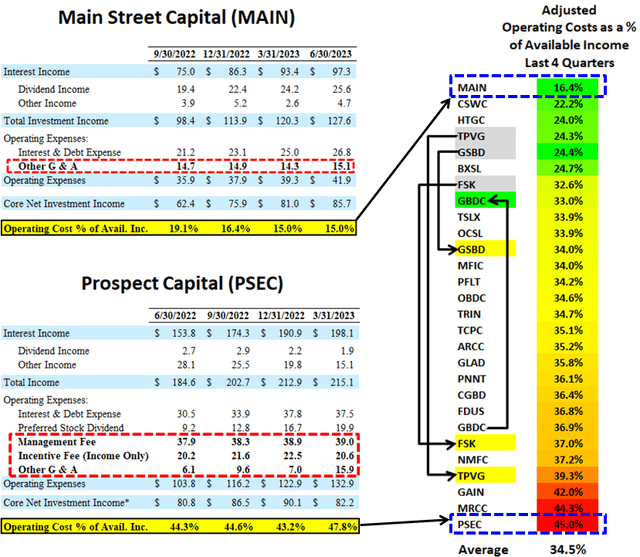
The following table includes the current price-to-NAV showing that investors pay higher multiples for BDCs with lower expense ratios because these BDCs can pay higher returns relative to NAV per share and the amount of income from the portfolio. As discussed earlier this month in the article “TRIN: Initiating Coverage Of This 14% Yielding BDC” linked above, TRIN’s expense ratio has not improved as the portfolio continues to grow, which is strange for an internally-managed BDC similar to MAIN, CSWC, and HTGC all of which have much lower expense ratios, as shown below. Please note that the expense ratio for TRIN has averaged 35.8% over the last two quarters which is higher than the 34.7% shown below (last four quarters).
BDC Buzz & SEC Filings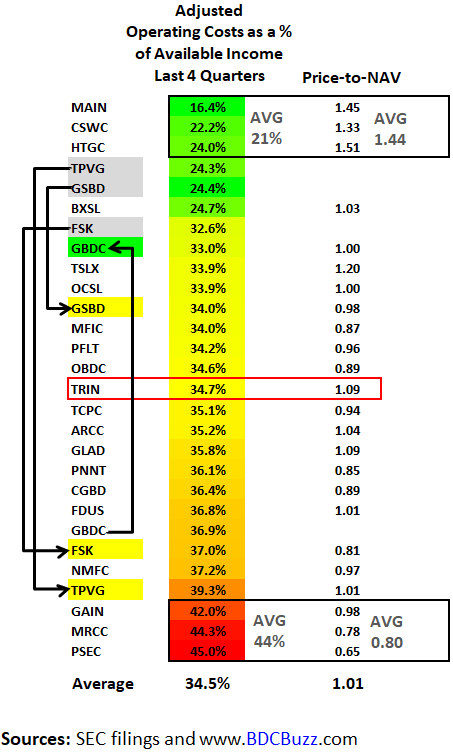
Conclusion and Other Considerations
Clearly, the returns for GBDC will improve over the coming quarters driving higher dividends paid to shareholders and likely a higher stock price relative to other BDCs which is one of the reasons I continue to hold this BDC position.
Please set your target prices accordingly using the following considerations some of which will be discussed in upcoming articles:
- Investment grade ratings by S&P, Moody’s, and Fitch
- A solid balance sheet with lower-cost unsecured borrowings
- Higher quality portfolio of 94% lower yield first-lien and one-stop loans with strong covenant and security protections in mostly non-cyclical sectors
- $50 million or $0.30 per share of net realized gains over the last 10 years
- 13-year history of relatively low defaults/credit losses
- Highly diversified portfolio with 333 investments and the top 10 accounting for 15%
- Adequate historical and projected dividend coverage
- Quarterly interest income has increased by 56% over the last four quarters
- Increased dividend income from its preferred equity positions that will likely continue
- Increased its regular quarterly dividend from $0.29 (in 2021) to $0.37 per share
- Variable portion of the dividend policy to pay out the excess earnings as rates remain higher and less likely to cut the base dividend if rates/yields trend lower
- The lowest base management fees at 1.00%
- 8% hurdle rate before management earns income incentive fees
- Cumulative ‘total return’ hurdle or ‘look back’ provision when calculating income incentive fees to protect shareholders from capital losses
Read the full article here

