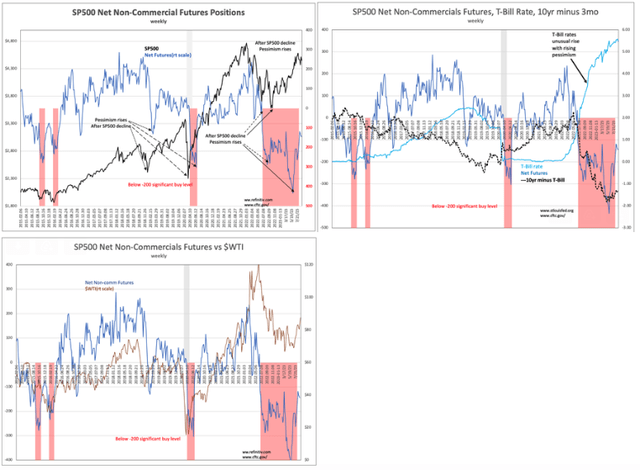
Market sentiment has improved from record lows of early June ’23 using the S&P 500 Net Non-Commercial Futures Positions (weekly data from Feb 2015) as the measure.
Fear began to creep in as the S&P 500 peaked in Dec 2021-Jan 2022. Since then, it has been non-stop recession predictions as the 10yr-3mo Treasury rate spread plunged from over 2.0% in April 2022 turning negative by Sept 2022 and proceeding to record inversion to -1.89% in Jun 2023, S&P 500 Net Non-Commercial Futures, T-Bill Rate, 10yr minus 3mo.
The spike in the T-Bill rate (3mo) made little sense unless one viewed this as part of algorithmic hedging of short T-Bills/long 5yr-10yr Treasuries. WTI (West Texas Intermediate crude oil price), long part of hedging, posted correlated lows, S&P 500 Net Non-Commercial Futures vs. WTI.
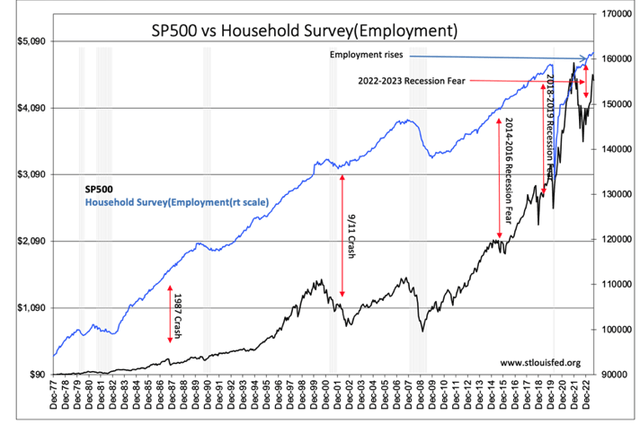
The consensus and the media are obsessed with the market’s short-term trend. In the discussion, the most important market predictor is ignored. That predictor is the long-term trend of employment.

The S&P 500 vs. Household Survey is monthly from Dec 1977. The red arrows indicate major periods when the S&P 500 fell in fear of recession yet the employment trend continued rising.
The many smaller dips in the S&P 500 when similar fear drove prices lower are not shown. There are too many instances. In every instance when the employment growth trend stalls and then rolls over, a recession occurs.
Regardless of WTI, market sentiment, interest rates and other short-term indicators used by algorithmic traders, if the employment trend is rising then so is the economy and eventually equities will follow.
That is what we see today. These other indicators can be categorized as sentiment-driven, as are the PMI (Purchasing Managers’ Index), Regional Federal Reserve Diffusion Indices and many more.
One must look carefully at the basis of any indicator as so many are conflated as economic when they are figments of market psychology.

The S&P 500 is well above the lows of Oct 2022, but sentiment continues to register a decent level of pessimism. The S&P 500 Net Non-Commercial Futures Position, currently -142.1, is 340pts below the 200 level of past periods of market optimism. The current market likely has 2yrs-5yrs of price increases till the next serious peak and market correction in my experience.
Original Post
Editor’s Note: The summary bullets for this article were chosen by Seeking Alpha editors.
Read the full article here


