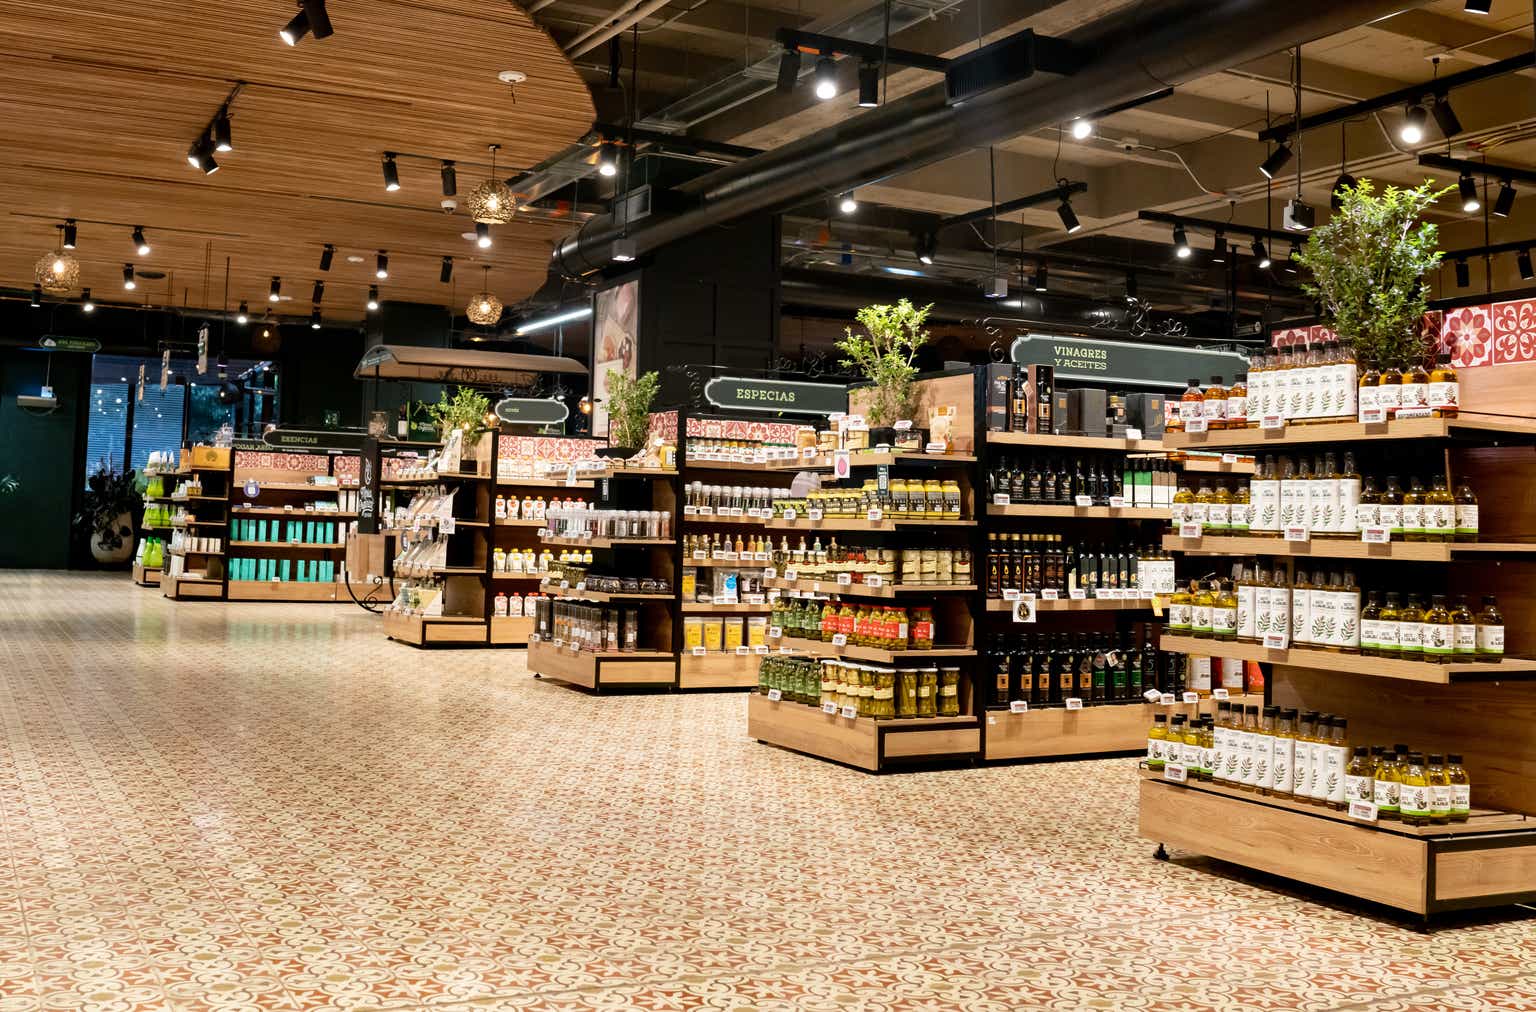
Brixmor Property Group (NYSE:BRX) is a mid-sized retail REIT with a current market cap of $6.62 billion. The New York headquartered company specializes in open air neighborhood and community shopping centers. These centers have some advantages, including reduced HVAC costs; only the stores need heating and air cooling, and reduced common area maintenance (CAM) costs. They also provide increased visibility for tenants and make curbside fulfillment of internet purchases easier than at an enclosed center. These properties tend to be more successful than traditional mall spaces, and helped lead the post-pandemic retail recovery.
Brixmor owns 367 shopping centers with a total of 65.0 million square feet, and 73.0% of these are grocery anchored. The current occupancy rate across the portfolio is 94.0% and the average shopping center size is 177,000 square feet. The company has reshuffled its portfolio over the years: in 2015 it reported 518 properties with 87.0 million square feet. Today, Brixmor’s centers are located across 28 states, mostly on the east and west coast, with some locations also in Ohio, Illinois and Texas. In its 2022 Annual Report, Brixmor stated that it tries to buy properties that will “be the center of the communities we serve.” The company’s tenants include mostly large discount retailers and grocery stores. This is an internally managed REIT and Standard & Poor’s rates Brixmor’s debt as BBB-, or lower investment grade.
Brixmor completed its IPO in 2013, debuting at $20.00 per share. The price peaked at $28.72 in August 2016 and shares are currently trading at $21.93, down 23.6%. The stock is significantly more volatile than the market with a beta of 1.56, and this can be used to your advantage.
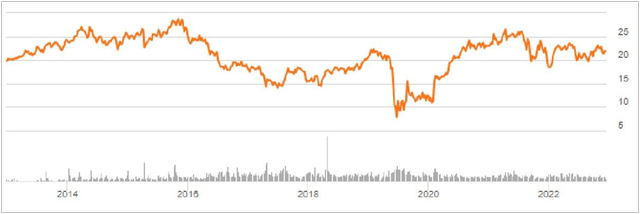
Share Price History (Seeking Alpha charts)
The Current Property Portfolio
Brixmor’s portfolio consists of mostly neighborhood shopping centers – these are usually defined as 30,000 to 125,000 square feet – which represent three-quarters of the portfolio. Regional shopping centers, the next largest group, are usually centers that have one million or more square feet and serve a specific city market. These are another 13.0% of Brixmor’s portfolio, as illustrated below, from the 2023 Investor Presentation.
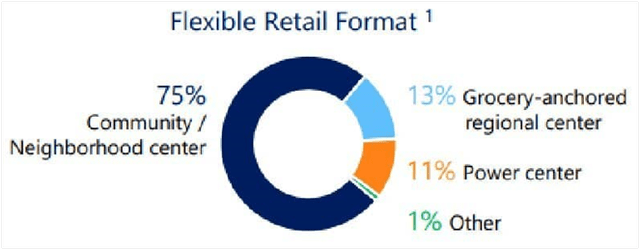
Brixmor Portfolio Distribution (2023 Investor Presentation)
Most of Brixmor’s properties consist of “large shops,” or anchors, and “small shops,” or the in-line spaces. The anchor space rent currently averages $9.18 per square foot, and the in-line space $25.79 per square foot. The rents in the portfolio today are below market and there is significant upside for the company on rollovers. The blended in-place rent for anchors and in-line space is $16.46, while the current market rent is estimated to be 22.2% higher at $20.12 per square foot. As of the second quarter 2023, anchor leased space occupancy was 96.2%, and small shop leased occupancy was 89.4%. Of course the small in-line shops have shorter lease terms and more rollover. They can be leased to local tenants and businesses that can move more easily than large anchors. In terms of Annualized Base Rents (ABR) in-line tenants are just under half the portfolio.
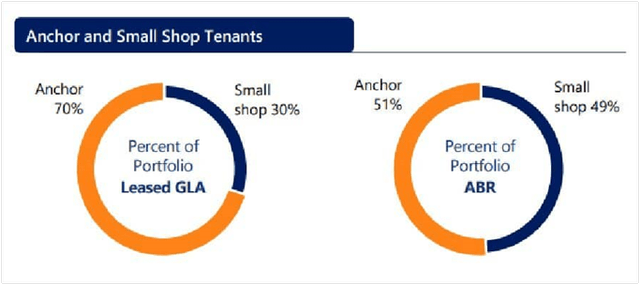
Anchor versus In-Line Space (Investor Presentation)
The top 10 tenants in the company’s 65.0 million square foot holdings, based on the ABR generated, are presented below. These represent 20.6% of the total square footage, and 16.5% of the rents. They are presented with their Standard & Poor’s sourced credit ratings.
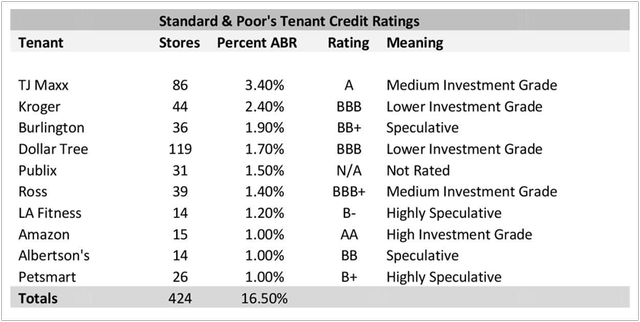
Top 10 Tenants and Credit Ratings (2022 Annual Report and author)
Other important tenants beyond the above list include Target (TGT), Ulta (ULTA), Big Lots (BIG), Kohl’s (KSS) and Best Buy (BBY). These latter companies each generate than 1.0% of ABR, per the Q2 2023 Report, but Kohl’s occupies a substantial 1.1 million square feet and Big Lots another 1.0 million square feet. CVS (CVS) and Home Depot (HD) each generate about 0.5% of ABR: CVS with 15 stores and Home Depot with five. The top 40 retailers in the company produce only one-third of the rental income and occupy about 38.0% of the space. So the portfolio is very broad in terms of the number of different tenants and diversified by the low percentage of space they occupy.
The most worrying tenants of this group are speculative-rated Burlington, LA Fitness and PetSmart. Burlington just delivered a strong third quarter, however, and reported earnings per share of $0.60, beating the consensus estimate of $0.43 by $0.17. Both LA Fitness and PetSmart are privately held, so there is not as much information on these as I would like. That said, these three companies collectively represent only 4.1% of the company’s annualized base rent; together they paid $38.4 million in rent in 2022. Total dividends paid for that year on common shares were $289.9 million. Funds from operations (FFO) for 2022 were $588.9 million, per the 2022 annual report, or $1.95 per share, for a payout ratio of 49.2%. Minus the rent of these tenants, the dividend payout is only 52.7%, still very well covered.
National and regional tenants pay 79.0% of the company’s ABR; the balance is local tenants, see the graphic below. Locals can have more rollover risk.
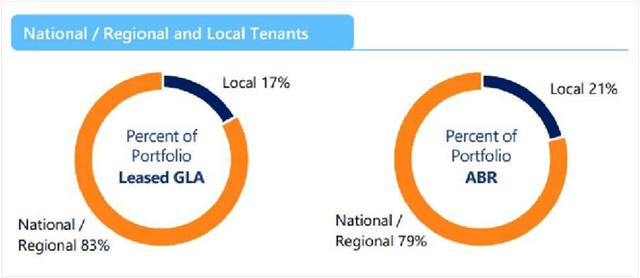
National versus Local Tenants (2023 Investor Presentation)
Below is a graphic of the in-line tenants by mix. As you can see the company is veering toward national and regional tenants for the smaller spaces, a defensive strategy.
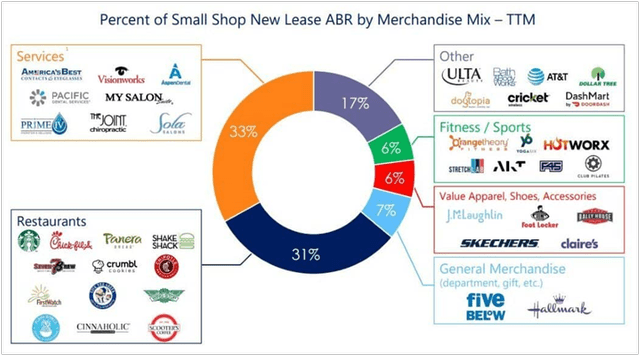
In-Line Spaces Tenants (Investor Presentation)
Notes on Lease Structure and Expirations
Brixmor’s open air centers consist of both anchors and in-line tenants. The 2022 annual report states that Brixmor prefers non-cancellable initial lease terms of 10 to 20 years for the anchors. These usually have multiple renewal options. I believe nearly all of the leases are triple net, in which the tenant pays for all costs associated with the property including taxes, insurance, and common area maintenance (CAM) if any. Structural reserve in this type of lease may be paid by either the landlord or the tenant. Occupancy across the portfolio was a blended rate of 94.0% as of mid-year 2023. The occupancy for the anchor tenants is currently 96.1%, and for the in-line tenants it is 89.3%.
In 2024, technically 12.7% of Brixmor’s portfolio expires, in terms of gross leasable area, see below. Assuming all the tenants renew all the options, then only 5.9% of the portfolio’s leases expire. In my experience the renewal rate of a retail tenant is closer to 70.0% probability, so maybe a total weighted probability of 7.9% of the gross leasable area will rollover, an acceptable number. This gives the company some continuity. At lease expiration, tenants can renew their lease or depart, so there is always an element of risk here. However, as I have cited previously, in my real estate experience I have found that most triple net retail tenants have multiple renewal options, often five years in length, and usually at a pre-negotiated rate. This rate will be higher than the base lease, but may be favorable compared to the current market rent. The probability of a tenant staying in place is usually also influenced by relocation costs and other factors. I look at this risk for Brixmor as not being excessive. See the charts below.
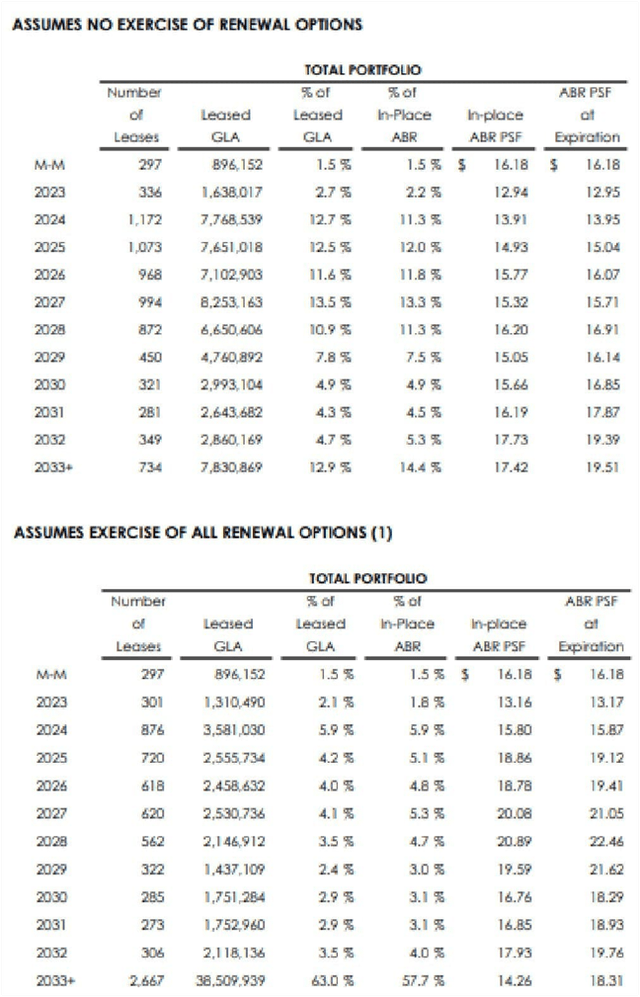
Lease Rollovers by Year (2022 Annual Report)
2023 Editing the Portfolio
Over the last decade, Brixmor has reshaped its portfolio substantially. It now has fewer properties than it did in 2015, and they are located in areas with higher population densities and higher household incomes than in the past. One third of the 2015 portfolio has been sold, per the 2023 Investor Presentation. In the last few years, Brixmor has also acquired properties that had low occupancy rates and turned them around. For example, it bought Cudahy Plaza, a 147,804 square foot shopping center in metro Los Angeles, and replaced a former Kmart with Burlington, Chuze Fitness, and Epic Wings. The center was also upgraded with new facades and pylon signage. It is currently in process of replacing a former Big Lots with a Sprouts Farmers Market, so the center will be fully leased. Brixmor is “selectively acquiring high-quality shopping centers from an identified target list,” so the company is buying and updating some older centers that are below stabilization (under leased).
In recent years, Brixmor has survived the bankruptcy or dissolution of two major retail tenants: Bed Bath & Beyond, and Tuesday Morning. Generally their spaces have been divided by two into smaller anchor units and released. For example, a Bed Bath & Beyond store became a HomeGoods and a Sprouts.
The portfolio re-shaping process continued this year; according to the second quarter 2023 report, the Company generated approximately $151.3 million of gross proceeds on the disposition of eight shopping centers, as well as seven partial properties, with 1.2 million square feet of gross leasable area. A table illustrating the significant portfolio changes between 2015 and 2023 is presented below.
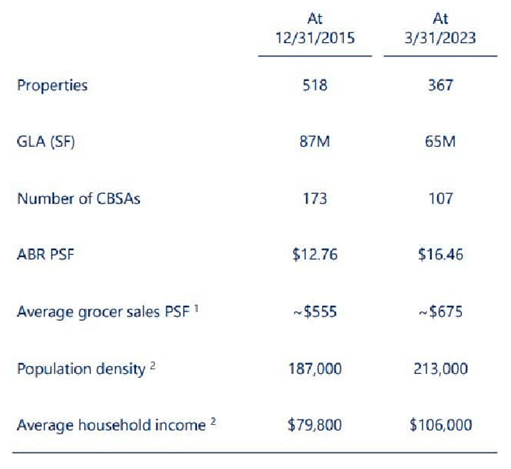
Portfolio Redistribution (2023 Investor Presentation)
Share Valuation
The market approach for REITs is Price/Funds From Operations (FFO), or better still Price/Adjusted Funds from Operations (AFFO). FFO is essentially the REIT cash flow. Below is a list of price to FFO and AFFO multiples for 13 different publicly listed retail REITs of various market caps. If the chart says N/A, the company did not publish this number. The average for this group was 13.75 for FFO and 13.4 for AFFO, a small difference.

Price to FFO/AFFO Multiples (Author calculated)
Brixmor does not publish AFFO but it does provide FFO numbers. This quarter, the FFO per diluted share was updated to $1.99 – $2.04, from $1.97 – $2.04. The number reported for 2022 was $1.95 per share. It also updated NOI growth expectations for 2023 to 2.5% – 3.5%, from 2.0% – 3.5% in the second quarter report.
Using a FFO of $2.00 per share and a conservative multiple of 13, the current fair value share price should be $26.00, so the shares are slightly undervalued, by say 15%. The current share price is $22.04.
I have also looked at using a cap rate applied to the FFO number to value the shares. The cap rates I considered were national strip shopping center and power center rates, similar to Brixmor’s portfolio in product type and geography. According to PricewaterhouseCoopers 2023 Emerging Trends Report: “the best retail opportunities by far remain grocery-anchored community and neighborhood centers, particularly those in primary or high-population growth markets…Grocery-anchored strip shopping centers remain highly sought after as both portfolio and single-asset deals.” This sounds very much like Brixmor’s portfolio.
Applying a cap rate to the FFO, is really a variation on the FFO multiple, which is the inverse of the cap rate. Except here, I have cap rate information from a national investor survey, a different source.

Retail Cap Rate Survey (PricewaterhouseCoopers)
The strip shopping center average was 7.23% last quarter. If I apply a 7.25% cap rate, as generally rates are rising, then the calculation becomes $2.00 of FFO per share/7.25% = $27.59 per share. So between the two methods, the value is between $26.00 and $27.59, let’s say about $26.50. So currently shares are 15.0% undervalued.
The Dividend Could be Higher
The company has paid dividends for nine years – generally. These began at $0.127 per share quarterly in 2014 and increased to $0.26 in the first quarter of 2023, for a compound annual growth rate of 8.3%. The dividend yield is currently 4.72%. This is generally lower than most of Brixmor’s peer group, which now have yields of 5.0-6.0% after recent market downturns. Realty Income (O) pays 5.54%; Simon Property Group (SPG) pays 6.62%; Kimco Realty (KIM) pays 4.95%; Alpine Income (PINE) pays 6.46%; and NNN REIT (NNN) pays 5.94%. Brixmor’s dividend payout ratio has varied from 38.8% to 52.0% of FFO (estimated for 2023) and this is on the lower end of industry norms. There is definitely room here for some dividend increases to be competitive. The company does not have a series of preferred shares outstanding.
It is important to note that during 2020, the company suspended its dividend during the second and third quarters, due to Covid. Brixmor had tenants owing back rent and struggling to pay. The dividend was resumed in the fourth quarter. Below is a calculation of the payout ratio by year.
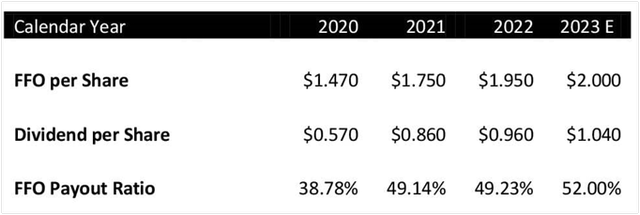
FFO Payout Ratio (Author)
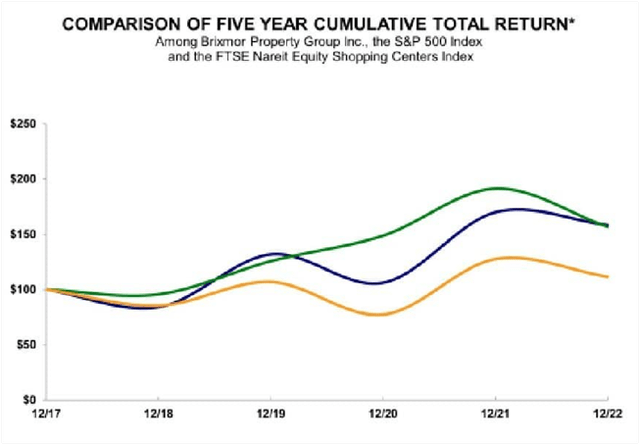
BRX Investor Return (2022 Annual Report)
Risks to Outlook
Brixmor does have diversification in terms of geography and has specialized in a (presently) strong segment of the retail market: grocery anchored neighborhood centers. However, the portfolio has been reshuffled quite a bit in search of the right formula. The result of this can be seen on the FFO numbers by year below:

FFO by Year (Annual Reports, author)
FFO per share peaked in 2017, and is presently lower; there is no definitive trend here to hang a share price on with certainty. This is why the shares are more volatile than the market. While grocery anchored neighborhood centers are strong now, it may not always be that way. There was some struggle during the early days of Covid.
The company’s total debt is about $4.9 billion, with total assets of $8.3 billion, or about 59.0%. A schedule of maturities is below:
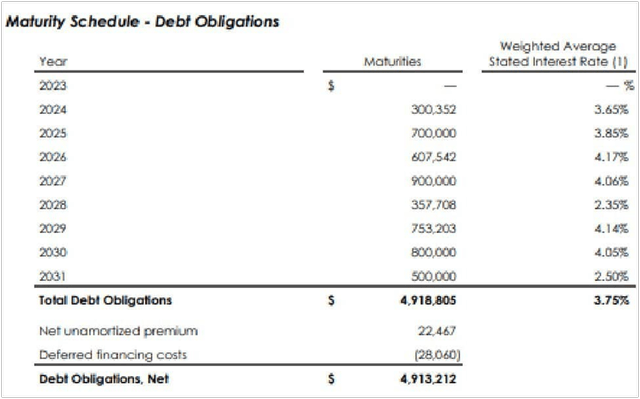
Debt Maturities (in thousands) (2022 Annual Report)
Conclusion
Brixmor has diversified its portfolio geographically, but less so across product type. However, that product type, grocery anchored neighborhood centers, is leading retail right now. Again, this may not always be the case. I do believe the shares are undervalued at their current level of $22.04, but I think the market is wary of the risk of higher rates or an economic downturn when applied to a retail REIT. It should be noted that the company has a new share repurchase program of up to $400.0 million of common stock. This program is set to expire in 2025 and may help support the price. However, the current yield of 4.72% is not high enough to entice me to buy this stock, versus money markets paying 5.25%, even though it is undervalued. Shares were $19.63 in May; at that price, the yield would be 5.3% and you would definitely see some share price appreciation in your future.
Read the full article here


