I am constantly on the lookout for new and interesting funds to analyze, and I recently came across the Motley Fool 100 Index ETF (BATS:TMFC). I was intrigued by TMFC’s 5 year average annual returns of 14.0%, which is better than the S&P 500 Index.
However, after further scrutiny, it appears the TMFC is simply a growth fund, as it is heavily exposed to Technology, Discretionary, and Communication Services stocks. Comparing the TMFC ETF against growth fund peers, I believe investors may be better off with the passive QQQ ETF when it comes to growth investing, as it is both cheaper and has delivered superior returns.
Fund Overview
The Motley Fool 100 Index ETF gives investors a low cost and convenient way to access high-conviction Motley Fool stock picks.
The TMFC ETF tracks the Motley Fool 100 Index (“Fool 100 Index”), an index measuring the performance of the 100 largest, most liquid U.S. companies recommended by The Motley Fool (“TMF”) analysts and newsletters.
To be eligible for inclusion in the Fool 100 Index, a company must be among the 100 largest domestic companies by market capitalization currently recommended by a TMF newsletter or among the 150 highest rated companies within the TMF analyst opinion database.
The Fool 100 Index is market cap weighted and the index is reconstituted and rebalanced quarterly.
Motley Fool
The Motley Fool is an investment education / newsletter service not too dissimilar to Seeking Alpha where new investors can learn about investing while seasoned investors can subscribe to a variety of TMF newsletters with some boasting impressive returns of 500%+ since inception versus the S&P 500’s return of 131% in the same timeframe (Figure 1).
Figure 1 – Overview of Motley Fool service (fool.com)
TMF’s investment philosophy aims for “long-term returns by buying and holding high-quality businesses with lasting competitive advantages, healthy balance sheets, high profit margins, and attractive returns on capital”.
After many years of running a successful newsletter service, TMF branched off into asset management in 2008 with the launch of mutual funds based on their stock picks. TMF further expanded in ETFs in 2018 with the launch of the TMFC ETF (Figure 2).
Figure 2 – Motley Fool history (fooletfs.com)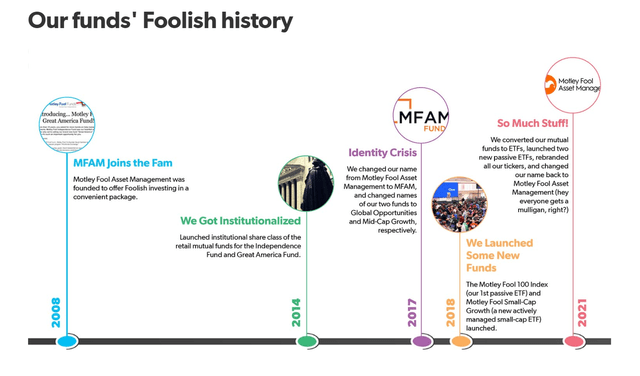
Today, the TMFC ETF has $551 million in assets and charges a 0.50% expense ratio (Figure 3).
Figure 3 – TMFC fund overview (fooletfs.com)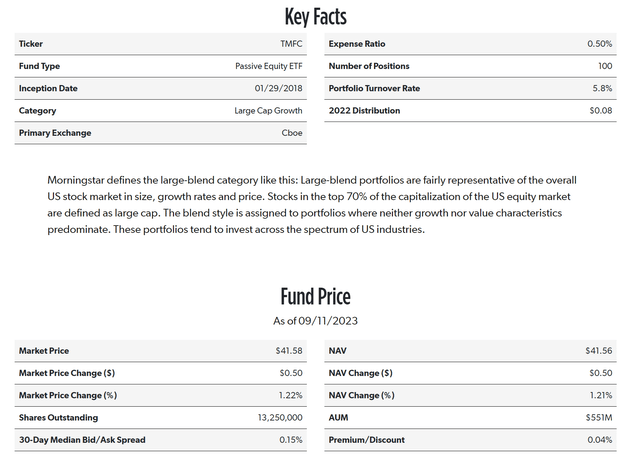
Portfolio Holdings
The TMFC ETF is currently very heavily overweight information technology stocks, with 42.1% of the portfolio compared to 28.3% for the S&P 500 Index, as of June 30, 2023 (Figure 4). Other sector overweights include Consumer Discretionary (15.2% vs. 10.7%) and Communication Services (13.9% vs. 8.4%).
Figure 4 – TMFC sector allocation (fooletfs.com)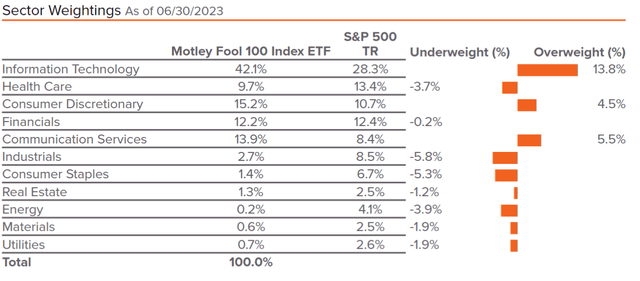
On the other hand, the TMFC ETF is underweight Industrials (2.7% vs. 8.5%), Consumer Staples (1.4% vs. 6.7%, and Energy (0.2% vs. 4.1%).
Investors should note that the TMFC ETF’s portfolio tends to be fairly sticky, with only a reported 5.8% portfolio turnover rate. For example, the TMFC ETF’s portfolio as of August 31, 2022, has essentially the same sector allocation as it does currently (Figure 5).
Figure 5 – TMFC sector allocation, August 31, 2022 (TMFC annual report)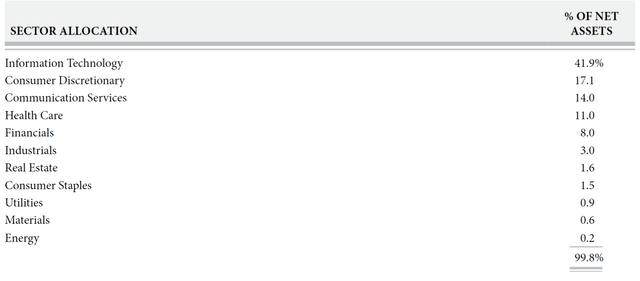
Distribution & Yield
The TMFC ETF pays a nominal trailing 0.2% distribution yield.
Returns
TMFC’s large sector exposures to the high growth Technology, Consumer Discretionary, and Communication Services sectors mean that the ETF has a fairly volatile returns history. For example, while the fund has excellent YTD and 1Yr returns of 36.3% and 22.7% respectively to August 31, 2023, its 3-year average annual returns are much more modest at 7.6% (Figure 5).
Figure 6 – TMFC historical returns (morningstar.com)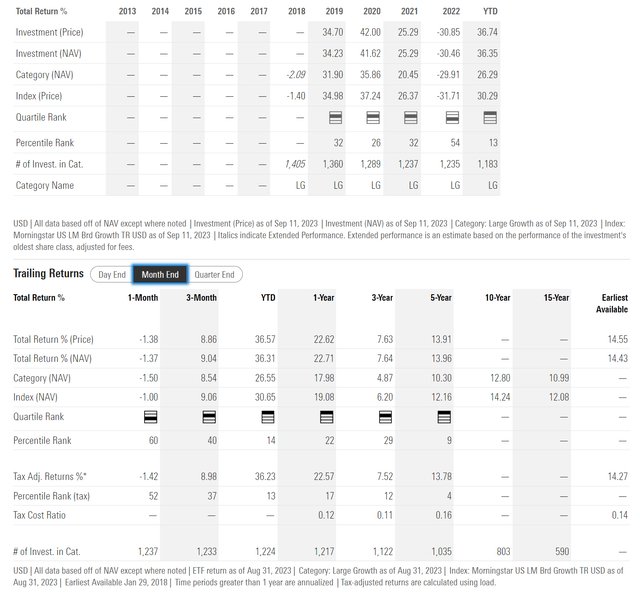
Figure 7 shows the historical returns of the SPDR S&P 500 ETF Trust (SPY) for comparison. Relative to the SPY, the TMFC ETF has done extremely well in the short term, with 1-year return of 22.7% vs. 15.8% for SPY. However, on a 3-year horizon, TMFC has underperformed SPY with returns of 7.6% vs. 10.4%. TMFC has outperformed on a 5 year horizon, with returns of 14.0% vs. 11.1%.
Figure 7 – SPY historical returns (morningstar.com)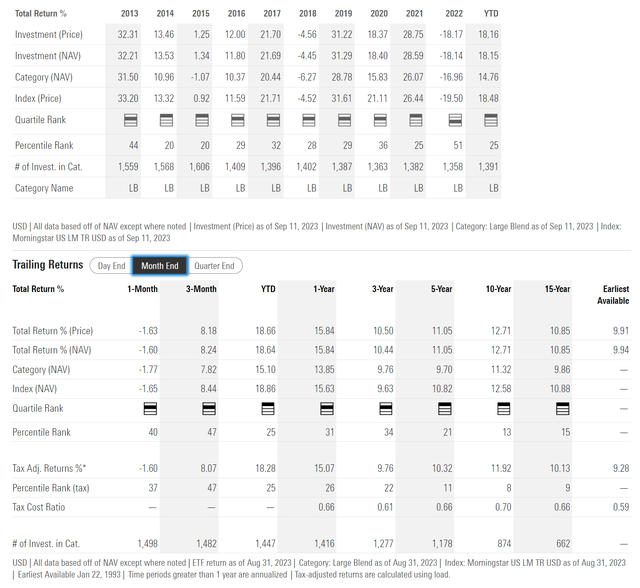
TMFC Is A Growth Fund
Essentially, the TMFC is a ‘bull market’ growth fund. If investors can identify bull markets ahead of time, then buying TMFC may lead to superior returns, as the TMFC ETF is heavily weighted towards high growth Technology, Consumer Discretionary, and Communications stocks that tend to outperform when risk appetites are high. However, without a crystal ball, it may be hard to time entries and exits in the TMFC ETF.
For example, Figure 8 compares the 5 year historical total returns of the TMFC ETF vs. SPY ETF using a line chart. The TMFC ETF tracked the SPY closely until the COVID-pandemic. Then during the early days of the pandemic, TMFC declined less than the market and also rebounded more strongly, setting up a large ~30%+ performance gap. However, by late 2022, the performance gap had largely closed as TMFC’s high growth stocks massively underperformed in 2022.
Figure 8 – TMFC vs. SPY (Seeking Alpha)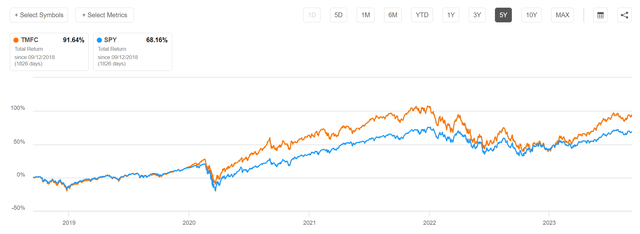
Since the start of 2023, TMFC has once again opened up a performance gap to the SPY, as investors are hungry for the high growth stocks within TMFC’s portfolio like Microsoft and NVIDIA.
How Does TMFC Compare To Growth Funds?
Having figured out the basic characteristic of the TMFC ETF, how does it compare against growth-focused funds like the Invesco QQQ Trust (QQQ), the iShares Russell 1000 Growth ETF (IWF), and the Vanguard Growth Index Fund ETF Shares (VUG)?
Comparing fund structures, the TMFC is the most expensive, with a 0.50% expense ratio compared to 0.20% for QQQ, 0.19% for IWF, and 0.04% for VUG (Figure 9). TMFC is also the smallest fund, although, with $551 million in AUM, it should have enough liquidity for most investors.
Figure 9 – TMFC vs. growth funds (Seeking Alpha)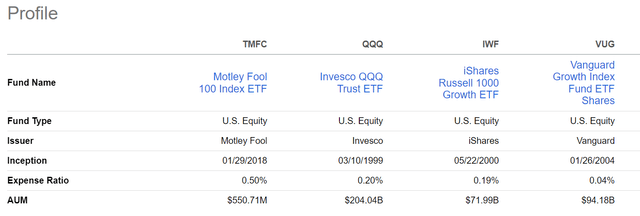
Moving on to returns, we can see that the TMFC ETF’s total returns over 5 years are slightly better than IWF and VUG, but significantly lower than the QQQ ETF (Figure 10).
Figure 10 – TMFC vs. QQQ, IWF, and VUG, 5 year returns (Seeking Alpha)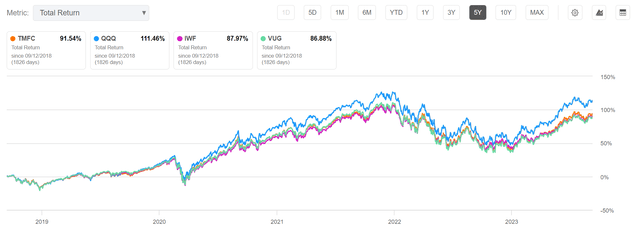
On a 3-year horizon, TMFC underperforms QQQ and IWF, but outperforms VUG (Figure 11).
Figure 11 – TMFC vs. QQQ, IWF, and VUG, 3 year returns (Seeking Alpha)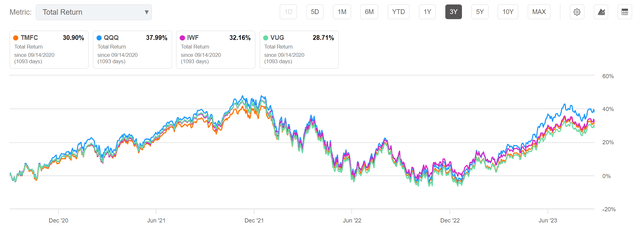
Finally, on a 1-year horizon, the TMFC ETF has outperformed IWF and VUG, but underperformed QQQ (Figure 12).
Figure 12 – TMFC vs. QQQ, IWF, and VUG, 1 year returns (Seeking Alpha)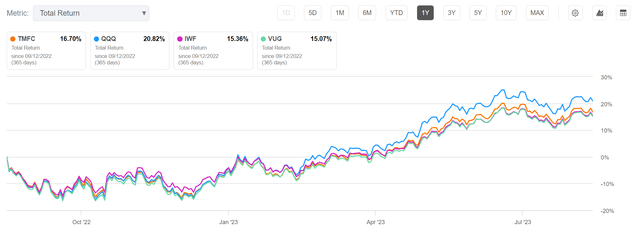
So for investors seeking growth exposure, an investment in the passive QQQ ETF may be a better bet than the TMFC ETF with both lower fees and higher returns.
Conclusion
The Motley Fool 100 Index ETF provides exposure to high conviction Motley Fool stock picks. Analyzing the performance of the fund’s sector allocation and returns history, the TMFC ETF appears to be simply a growth fund. However, compared to growth fund peers, the TMFC ETF has significantly underperformed the QQQ ETF over the past 5 years. Investors looking for growth exposure may be better off investing in the simple QQQ ETF instead.
Read the full article here


