
Investment Thesis
The purpose of this article is to initiate coverage on the iShares U.S. Tech Independence Focused ETF (BATS:IETC), previously known as the iShares Evolved U.S. Technology ETF. IETC is an actively managed fund relying on a proprietary system that allows companies to be classified into multiple sectors, unlike how the majority of its peers operate. As a result, investors gain access to a broader group of companies, and so far, the results have been positive. IETC is the tenth-best-performing Tech ETF out of 25 since its 2018 launch, and it has demonstrated an ability to outperform in market downturns. For only 0.18% in annual fees, I suggest tech investors add IETC to their watchlists, and I look forward to explaining why in more detail below.
IETC Overview
IETC is an actively managed ETF with no benchmark. However, practically speaking, it aims to outperform other Tech ETFs, of which there are at least 35 others. One of the ways it does this is by using a proprietary system that allows a company to be classified into multiple sectors. According to FactSet Analytics:
IETC…is generally weighted by market cap, targeting an increased exposure to companies with high Technology Independence Score, calculated based on technological capabilities, revenues, and production in the US and select global markets.
Given it’s an actively managed fund, you might assume IETC has plenty of trading activity. However, portfolio turnover has been in the single digits since the fund launched in March 2018.
iShares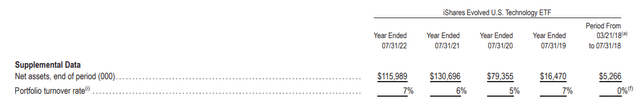
As a result, I view IETC more like another tech-focused ETF with a bit better diversification than more popular plain vanilla funds like the Technology Select Sector ETF (XLK). To be sure, IETC is not the only ETF not relying on Global Industry Classification Standards. The SPDR NYSE Technology ETF (XNTK), the iShares U.S. Tech Breakthrough Multisector ETF (TECB), and the Invesco NASDAQ Internet ETF (PNQI) are all multi-sector funds, as shown below.
Morningstar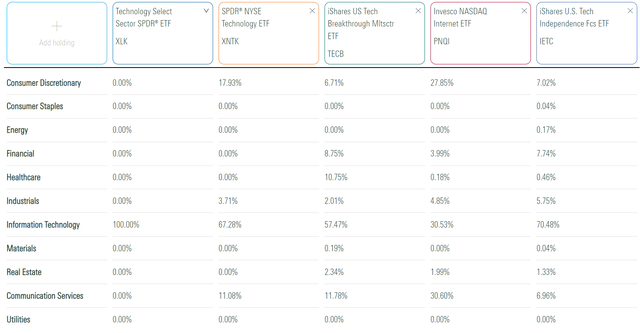
Except for XLK, IETC has the most exposure to the Technology sector (70.48%), according to GICS. Amazon (AMZN) is the key Consumer Discretionary holding, while Alphabet (GOOGL) and Meta Platforms (META) combine for 6.00% of the fund’s 6.96% Communication Services sector exposure. Several Transaction Payment and Processing Services stocks like Mastercard (MA) and Visa (V) contribute to IETC’s Financials sector exposure. Finally, 30/170 holdings are in the Industrials sector, including Boeing (BA), Automatic Data Processing (ADP), and Lockheed Martin (LMT). Again, you won’t find these stocks in XLK, the Vanguard Information Technology Fund (VGT), or any other tech ETF that classifies stocks based on GICS. The benefits include greater diversification, but there’s also a greater chance it will overlap with other holdings in your portfolio.
PNQI is an interesting alternative I covered last month, as it splits roughly evenly between Consumer Discretionary, Technology, and Communication Services. Meanwhile, XNTK and TECB have exposures closer to IETC, so they might be the best direct comparators.
IETC Performance Analysis
The following table highlights IETC’s performance compared to XLK, PNQI, and XNTK. I omitted TECB because it launched after IETC, so I couldn’t get a complete comparison. However, I’ve included it in the more comprehensive performance analysis that follows.
Portfolio Visualizer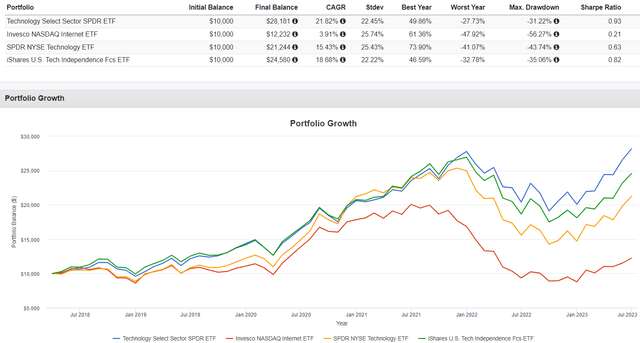
It’s a relatively short measurement period, but IETC gained an impressive 18.68% per year compared to 15.43% for XNTK. PNQI was easily the worst performer at 3.91%, and its structure was the primary reason. The 56.27% drawdown listed was from July 2021 to December 2022, when Amazon, Meta Platforms, and Alphabet declined by 51.05%, 65.39%, and 27.73. That’s tough to recover from when they’re an ETF’s top three holdings, so I’m hoping for a better balance with IETC.
Seeking Alpha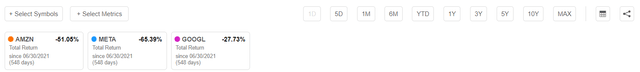
Still, XLK’s 21.82% total gain was the best from a returns and risk-adjusted returns perspective. One impressive feature is the ETF’s 9.83/10 Profit Score, which I calculated using individual Seeking Alpha Profitability Grades. Investing in high-quality companies is critical to long-term wealth building, and it’s something PNQI doesn’t have, as suggested by its 8.62/10 Profit Score. Differences in profitability explain why some companies bounce back quicker than others, so along with diversification, high profitability is something I hope IETC also achieves.
Before we get to its fundamentals, let’s look at how IETC performed against other tech ETFs. There are 36 in the table below, with 25 having a track record at least as long as IETC. Total returns are from April 2018 to August 2023, assuming all dividends were reinvested.
The Sunday Investor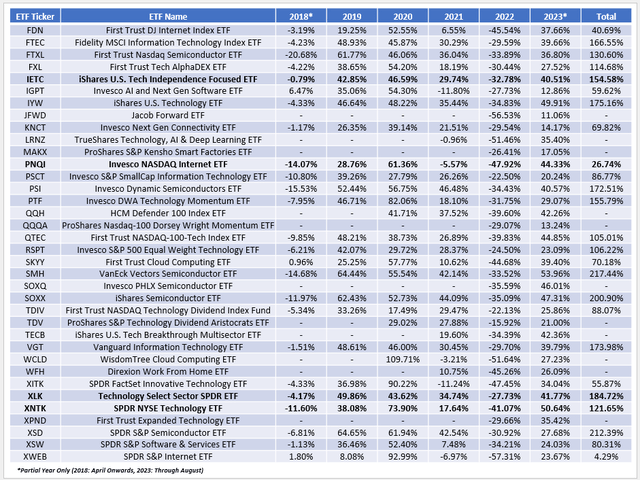
IETC’s 154.58% total return ranked #10/25, a bit above average. However, four were semiconductor-focused funds (SMH, XSD, SOXX, PSI) and aren’t really in the same category as broad-based funds like XLK, IYW, VGT, FTEC, and PTF, which all outperformed IETC. For readers assuming past performance will repeat, it’s a hard sell that IETC will outperform. However, IETC beat all five in 2018, and its 0.79% decline was fourth-best overall behind IGPT, XWEB, and SKYY. While the ETF didn’t fare so well last year, we should assess where we are now and let current fundamentals and an evaluation of market sentiment drive our decision. Let’s look at that next.
IETC Fundamental Analysis
The following table highlights selected fundamental metrics for IETC’s top 25 holdings. I’ve also included summary metrics for some of the other ETFs discussed in the bottom rows.
The Sunday Investor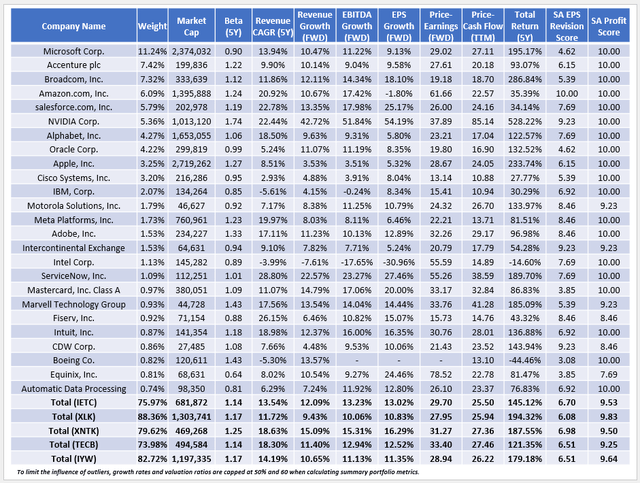
A few observations:
1. As hoped, IETC’s diversification is better than what plain vanilla funds like XLK offer, with 75.97% of assets in its top 25. However, that’s also true for the other multi-sector ETFs listed. In IETC’s case, Microsoft (MSFT) is the largest holding with an 11.24% allocation, and those with trillion dollar valuations combine to total 30.21%. That figure is 50.98%, 16.92%, 20.24%, and 49.95% for XLK, XNTK, TECB, and IYW. Therefore, if you want to diversify away from ultra-mega-cap stocks, your best bet is XNTK or TECB, which follow an equal and tiered weighting scheme. Finally, FactSet Analytics’ earlier claim that IETC is generally market-cap-weighted appears inaccurate. Accenture (ACN) and Broadcom (AVGO) are sandwiched between Microsoft and Nvidia (NVDA), so IETC’s weighting scheme is more complex than that.
2. IETC’s 9.53/10 Profit Score is excellent, eighth-best among the 36 Technology ETFs listed earlier. To reiterate a prior point, even if ETF declines substantially in the near term, it will likely recover quickly. In contrast, ETFs like the Jacob Forward ETF (JFWD), the TrueShares Technology, AI & Deep Learning ETF (LRNZ), the WisdomTree Cloud Computing ETF (WCLD), and the SPDR S&P Internet ETF (XWEB) all declined over 50% in 2022. Their profit scores are 5.01/10, 7.45/10, 6.23/10, and 6.37/10, respectively, which is not coincidental.
3. IETC looks better than XLK from a growth perspective. Its estimated revenue, EBITDA, and EPS growth rate slash line is 12.09% / 13.23% / 13.02% compared to 9.43% / 10.06% / 10.83% for XLK. Looking at the statistics for Apple (AAPL) and Microsoft, which comprise 46.72% of XLK, we can see why. Especially with Apple, growth rates are below average, yet they still command premium valuations of around 29x forward earnings. It’s a good reason for growth investors to avoid market-cap-weighted ETFs like XLK and VGT. If you’re unhappy with IETC’s 3.25% allocation, you can also just buy the stocks directly.
4. XNTK has the best earnings per share growth and forward earnings valuation combination of the five ETFs. Dividing one ratio into the other, XNTK’s PEG ratio is 1.92 vs. 2.28, 2.58, 2.67, and 2.55 for IETC, XLK, TECB, and IYW. With this ratio, favored by growth-at-a-reasonable-price investors, it’s best to have it as low as possible. Some investors place great importance on this metric, but I use it to identify red-flag scenarios to avoid substantially overpaying for an ETF. Of the 36 ETFs listed in the earlier table, IETC’s 2.28 ratio ranks #17, so while not ideal, I’m also not too concerned.
Investment Recommendation
IETC has several attractive features, including a reasonably diverse set of holdings crossing five sectors, a solid six-year track record, an excellent profit score, and a low 0.18% expense ratio. Also, I like that it offers more growth than XLK, the default Technology for most investors. It limits exposure to Apple, which only provides low-single-digit sales and earnings growth and could be vulnerable in a market drawdown. While I’m not prepared to jump into Technology stocks, as they’ve already exceeded my expectations for the year, I find IETC a nice choice for tech investors looking to avoid too much exposure to ultra-mega-cap stocks. It’s a hold for today, but I suggest adding it to your watchlist, and I look forward to checking back in later this year as market conditions change. Thank you for reading.
Read the full article here

