
IVLU strategy and portfolio
iShares Edge MSCI Intl Value Factor ETF (IVLU) started investing operations on 6/16/2015 and tracks the MSCI World ex USA Enhanced Value Index. It has $1.7B under management, a portfolio of 347 stocks, a 12-month distribution yield of 3.63% and an expense ratio of 0.30%. Distributions are paid quarterly.
As described in the prospectus by iShares, the fund invests in large and mid-cap companies of developed countries except the U.S. The value style is defined by “three accounting variables based on publicly reported financial data: price-to-book value, price-to-forward earnings and enterprise value-to-cash flow from operations. The Index Provider calculates a “value score” based on these three variables. MSCI assigns weights by multiplying a component’s value score by its market capitalization. Weights in the Underlying Index are next normalized so that sectors in the Underlying Index represent the same weight as in the Parent Index.” In the most recent fiscal year, the portfolio turnover rate was 17%, which is quite low.
In this article, I compare IVLU with its most popular competitor by the same issuer: iShares MSCI EAFE Value ETF (EFV), which tracks the MSCI EAFE Value Index. Both are value-style funds invested in developed markets excluding the U.S., mostly in large and mega-cap companies (about 91% of asset value for IVLU, 88% for EFV). EFV is an older, larger and more liquid fund, with a similar fee and a slightly higher turnover, as noted in the next table.
|
IVLU |
EFV |
|
|
Inception |
6/16/2015 |
8/1/2005 |
|
Expense Ratio |
0.30% |
0.34% |
|
AUM |
$1.72B |
$17.24B |
|
Average Daily Volume |
$5.90M |
$125.58M |
|
Number of Holdings |
367 |
505 |
|
Turnover |
17% |
26% |
|
Weight in Top 10 |
18.99% |
19.18% |
|
Yield |
3.63% |
3.75% |
IVLU is a bit cheaper than EFV regarding valuation ratios, as reported below.
|
IVLU |
EFV |
|
|
Price/Earnings TTM |
8.77 |
9.88 |
|
Price/Book |
0.95 |
1.12 |
|
Price/Sales |
0.72 |
0.88 |
|
Price/Cash Flow |
5.71 |
6.06 |
Source: Fidelity
The next table reports aggregate growth rates in the trailing 12 months. They are mixed and there is no clear winner on this point.
|
IVLU |
EFV |
|
|
Earnings growth % |
18.12% |
15.87% |
|
Sales growth % |
9.65% |
10.53% |
|
Cash flow growth % |
9.23% |
11.29% |
Source: Fidelity
Europe is the heaviest region in both funds, with about 55% of asset value for IVLU and 63% for EFV. The top two countries are Japan and the UK in both funds, but IVLU is really overweight in Japanese companies (35.8% of assets), whereas EFV is more diversified geographically. The next chart plots the top 12 countries, representing about 95% of assets for IVLU and 91% for EFV. Hong Kong weighs 1.8%, so direct exposure to geopolitical and regulatory risks related to China is very low. A minor difference: EFV ignores Canada.
Country allocation (chart: author: data: iShares)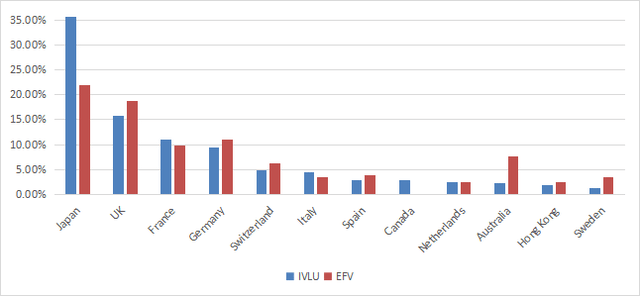
The two funds also share the same top two sectors: financials and industrials. In this matter, IVLU is better balanced, whereas EFV is overweight in financials (28.6%). IVLU significantly overweights technology relative to its peer.
Sector breakdown (chart: author: data: iShares)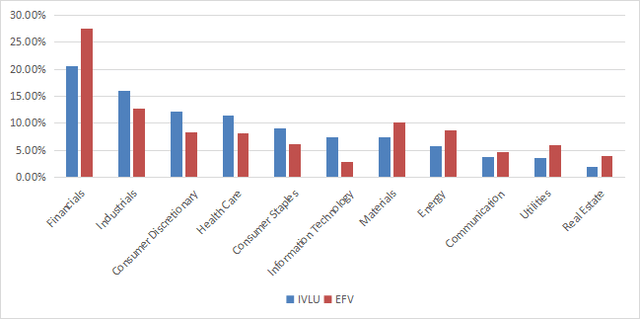
The next table lists IVLU top 10 holdings, representing 19% of assets. The heaviest one weighs 2.6%, so risks related to individual companies are low. EFV has almost the same weight in its top 10 components, and the top name is at 2.7%.
|
Name |
Weight % |
Sector |
Ticker |
Location |
|
TOYOTA MOTOR CORP |
2.6 |
Consumer Discretionary |
7203 |
Japan |
|
BRITISH AMERICAN TOBACCO PLC |
2.41 |
Consumer Staples |
BATS |
UK |
|
NOVARTIS AG |
2.29 |
Health Care |
NOVN |
Switzerland |
|
SANOFI SA |
2.02 |
Health Care |
SAN |
France |
|
HSBC HOLDINGS PLC |
2.01 |
Financials |
HSBA |
UK |
|
SHELL PLC |
1.84 |
Energy |
SHEL |
UK |
|
MITSUBISHI UFJ FINANCIAL GROUP INC |
1.51 |
Financials |
8306 |
Japan |
|
STELLANTIS NV |
1.47 |
Consumer Discretionary |
STLAM |
Italy |
|
MITSUBISHI CORP |
1.43 |
Industrials |
8058 |
Japan |
|
ROCHE HOLDING PAR AG |
1.43 |
Health Care |
ROG |
Switzerland |
Performance
Since 9/1/2015, IVLU has outperformed EFV by about 7% in total return: it is less than 1% annualized.
IVLU vs EFV since 9/1/2015 (Seeking Alpha)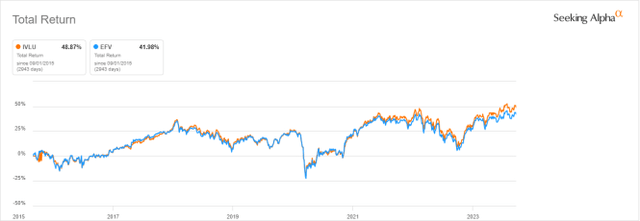
In 2023 to date, IVLU is ahead by about 2.5%.
IVLU vs EFV year-to-date (Seeking Alpha)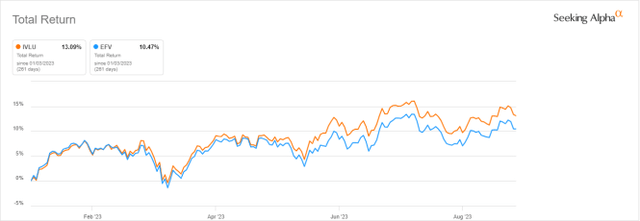
Between 2016 and 2022, the annual sum of distributions has increased by 48% for IVLU and only 23% for EFV. However, EFV distributions have kept pace with inflation, which has also been about 23% in the same time, based on CPI.
|
Annual distributions/share |
IVLU |
EFV |
|
2016 |
$0.56 |
$1.55 |
|
2022 |
$0.83 |
$1.91 |
|
Total dividend growth |
48.2% |
23.2% |
Takeaway
iShares MSCI Intl Value Factor ETF (IVLU) is an ex-US large cap value ETF, just like its more popular peer EFV. The next table presents a summary of their comparison.
|
winner |
|
|
Liquidity and AUM |
EFV |
|
Expense ratio |
IVLU (shortly) |
|
Turnover |
IVLU |
|
Geographical diversification |
EFV |
|
Sector diversification |
IVLU |
|
Holding diversification |
On par |
|
Valuation |
IVLU (shortly) |
|
Growth |
On par |
|
Return |
IVLU (shortly) |
|
Yield |
On par |
|
Dividend growth |
IVLU |
With one point per line, IVLU wins. However, its concentration in Japan may be an issue for some investors, and these criteria may not have the same importance for everyone. Feel free to give them weights and make your own score.
Read the full article here

