Investment briefing
There is risk capital to be unlocked in the equity of US Lime & Minerals (NASDAQ:USLM) in my informed opinion. A number of inflection points feed into this view, including market fundamentals, USLM’s economic value, and supportive valuations.
USLM operates as a manufacturer of lime and limestone products, serving key sectors like construction, steelmaking, environmental, agriculture, and oil + gas services. The company books revenues on lime and limestone sales, all based in the U.S. Additionally, USLM holds natural gas interests through its wholly owned subsidiary, U.S. Lime Company-O&G.
This report will analyse USLM from a number of standpoints and link back to the broader buy thesis. Net-net, there is economic value in USLM’s operations, and it can sport a valuation of ~$216-$231/share if it continues on its current trajectory. Rate buy.
Figure 1.
Data: Updata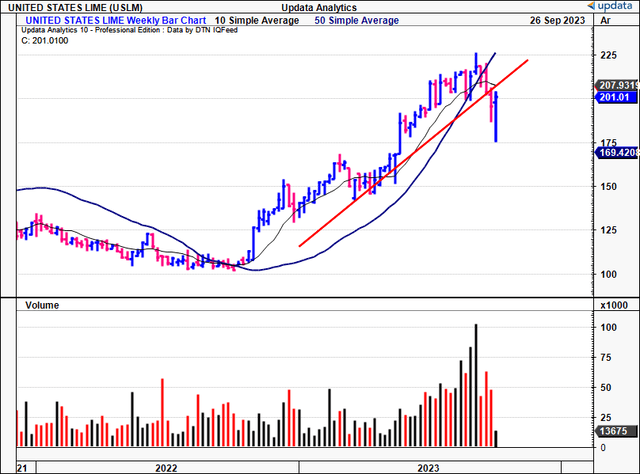
Critical investment factors underpinning buy thesis
1. Market considerations
Lime and limestone has a broad range of applications across industry. The market was valued at $72.31Bn in FY’22, and Grand View Research projects it to grow at a CAGR of 7.3% from 2023-2030. The market is segmented based on application, namely, industry lime, chemical lime, construction lime, and refractory lime. Interestingly enough, growing investments in water treatment and purification are expected to drive the demand for limestone in the U.S.
In the construction industry, limestone is used in cement, wall cladding, and decorative applications. The construction sector dominated the market in FY’22, accounting for >82% of limestone market share. Demand of lime in construction is expected to remain strong due on the back of growth in global infrastructure.
Limestone is also essential in steel refining. As Calcinor states, “[t]he steel industry cannot be conceived without the use of lime, ever-present during the whole steel-making process“. It is used as a fluxing agent in basic and electric furnaces, by removing impurities like sulfur and phosphorus from the end product. It also provides protection to furnace and converter refractory linings. Critically, limestone contributed to ~27% of crude steel production in basic oxygen furnaces and ~9% in electric arc furnaces, per Grand View.
2. USLM latest numbers
USLM put up Q2 ’23 revenues of $74mm, up 22.3% YoY. Sales of lime and limestone revenues pushed ~24% higher and clipped basically all of this turnover. This YTD, lime and limestone revenues grew by 27.6% YoY, reaching $140.2mm, compared to $109.9mm in H1 last year. Growth was underscored by a combination of higher volumes (demand) and higher selling prices. Management reported its environmental and oil + gas service customers were the main revenue drivers for the YTD. It pulled this to Q2 gross of $27.1mm on a margin of 36.7%, up ~65% YoY and a pre-tax margin of 39%, an increase 9 percentage points from Q2 last year, as seen in Figure 2.
Equity holders have financed ~90% of the company’s total assets, and the capital structure is favourable for the equity investor. You can see in Figure 2 the company had ~$63/share in tangible book value, up 20% YoY. That’s in line with the equity benchmark’s return over the last year-clear indication of the value-add in my view.
USLM invested $15.4mm in CapEx during H1, slightly less than the $17.1mm spent during H1 ’22. But I’d point out it booked $5.6mm for the acquisition of Mill Creek under CapEx last year. It also paid out $1.1mm in dividends, amounting to $4.5mm over the last 12 months. It left the quarter with $156.2mm in cash on hand and no leverage, as mentioned.
BIG Insights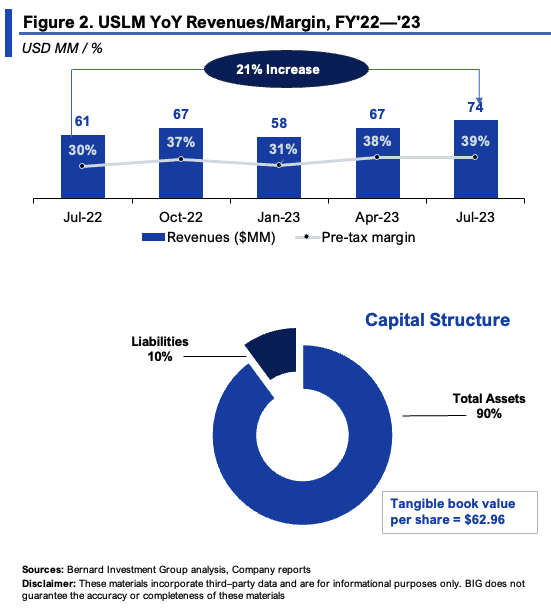
3. Economic drivers of performance
A critical takeout from USLM’s YoY growth is the economic factors beneath its operations. We see this in a number of ways.
Figure 3 compares the company’s gross profit as a percentage of total assets employed in the business on a rolling TTM basis. All core and non-core assets are included. From 2020-2023 YTD, the company increased gross productivity from $0.24 per $1 in assets to $0.28 on the dollar. This, after rotating $123mm of retained earnings into assets employed.
BIG Insights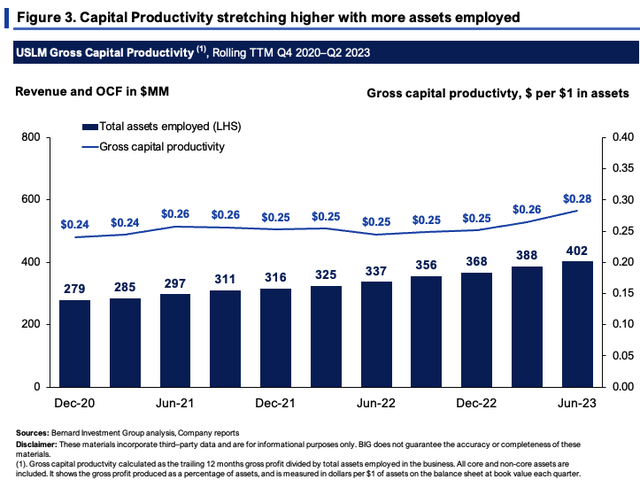
How USLM has pushed gross productivity higher is important. Critically:
(1). The company’s cash conversion cycle (“CCC”) reduced 8 days since 2020 such that it recycled $1 invested to NWC back to cash in ~82 days, less than 3 months [Figure 4]. This is important considering its capital allocation (discussed later). It can turn over NWC ~4.5x each year at this rate (365/82 = 4.45).
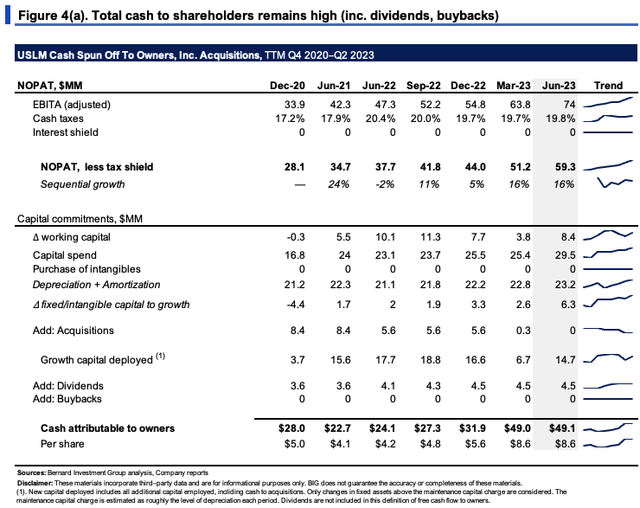
(2). USLM is investing heavily into growing the business without hindering FCF growth as well. Figure 4(a) depicts the cash it has spun off to shareholders after all growth investments deployed. Growth capital is considered all capital employed (including cash to acquisitions) above the maintenance level of investment. Only changes in fixed assets above the maintenance capital charge are considered, where the maintenance charge is approximated at depreciation each period. Dividends paid up are also included in this definition.
As shown, USLM has grown its allocations to growth from $3.7mm in 2020, to ~$15mm in Q2 FY’23 (TTM values). At the same time, post-tax earnings have grown from $28mm to $59mm, and USLM spun off $8.60/share in cash to shareholders last period, more than double Q2 last year.
BIG Insights BIG Insights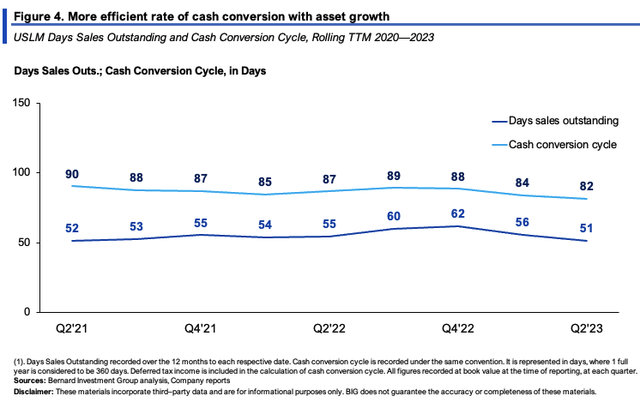
The question I routinely have to answer and present to our investment committee for each new idea is simple: “Will this company be a good custodian of our money?” For ULSMD, the economics do all the answering here:
- It had invested $387mm at risk in operations in Q2 FY’23, around $68/share, up from $47.70/share in FY’20 ($19.30/share incremental investment).
- The $68/share of capital invested produced $10.41/share in trailing post-tax earnings last period, more than double its FY’20 range of $5.01/share. This equates to 15% return on investment (considering existing capital).
- So the $19.30 per share of incremental investment grew NOPAT by $5.39 per share, otherwise 28% return on new capital. Each quarter since 2020 the company has produced a double-digit rate of return on its new investments, ranging from 20%-43%, whilst reinvesting ~30% of NOPAT each period.
- Perhaps most critically, the ROIC has pushed from 10.5% in 2020 to 15.3% last period, having grown sequentially across each set of earnings since then.
A key differentiator within construction materials is the ability to sell niche offerings to the market. Lime and limestone is a good example of this. You see this in USLM’s business economics. Post-tax margins came in at 22.4% last period on capital turnover of 0.7x. For one, this squares off with the economics of the business model. It sells its products to market at a premium, doesn’t rely on huge inventory turnover. To me this says it enjoys consumer advantages and can price its offerings above industry averages. I’d say this is fairly important in an inflationary world as well.
Source: BIG Insights, Company reports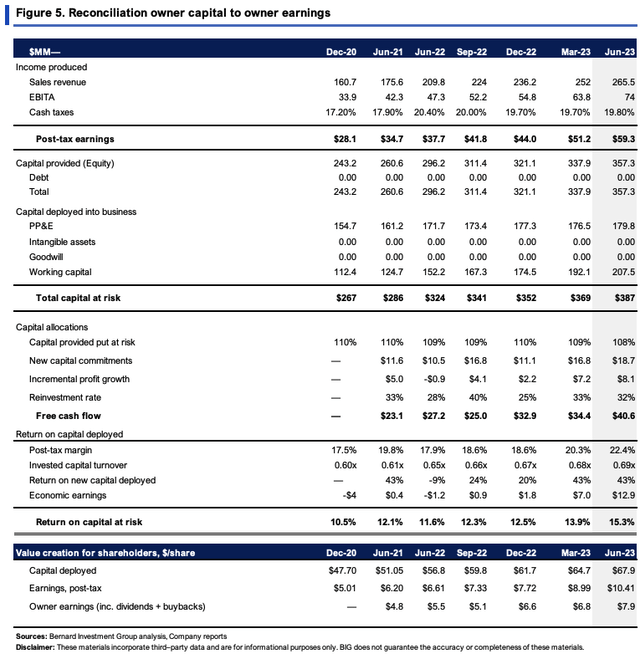

The economic value on these numbers is clear when looking at Figure 6. We employ a 12% return on capital as a core competency across all equity holdings. Keeping this in mind:
- The firm has outpaced this earnings rate on capital over the last 12 months. Anything above the 12% capital charge to its investments is economically valuable here.
- The economic earnings have grown at an attractive pace and were $2.26/share last period.
- Most importantly, it has increased as a percent of revenues from 0.4% in 2022 to 4.8% last period (TTM values), and was 21.7% higher than the required rate of NOPAT.
In my view these are exceptional economics that support a buy rating.
BIG Insights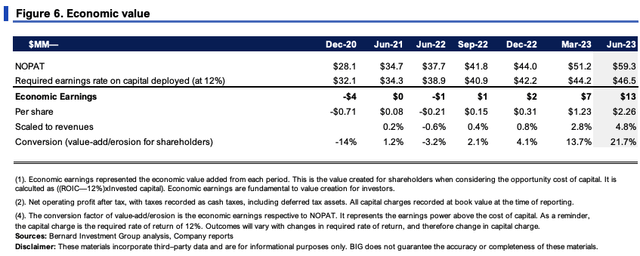
Expectations and projections at steady-state
A granular look at USLM’s 3-year growth drivers is seen in Figure 7. Sales have grown at a 5% rate on stable operating margins of ~24%. I’m most interested in the capital allocation. Each $1 in new sales required $0.91 investment to NWC, and just $0.24 to fixed assets (M&A has been lumpy as expected).
This squares off with the economics of the current environment. Inputs have gone up in price, notwithstanding inventory costs and the price gains on USLM’s end outlined a little earlier.
BIG Insights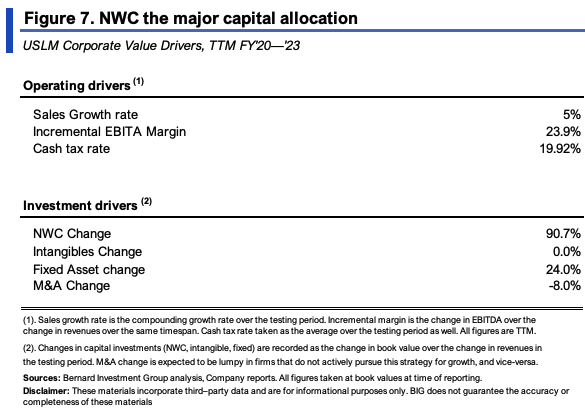
These are reasonable expectations to carry forward in my view. A 5% revenue growth in FY’23 isn’t out of the water, and we can make some assumptions on the capital requirements to hit these numbers:
(i). To hit a 5% revenue growth rate this would grow sales to $341mm on NOPAT of $65mm (at a 19% tax rate).
(ii). This implies an assumption for required investment of $16mm-$19mm per quarter ($64-$76mm annualized) and spin off $37-46mm in trailing FCF to its owners.
(iii). I’d look for ~24% margins after-tax on this to recognize 13-14% return on capital, factoring in the c.31% reinvestment rate.
At this rate, USLM could compound its intrinsic value at an average of 5% per quarter into FY’24, 35% cumulatively.
BIG Insights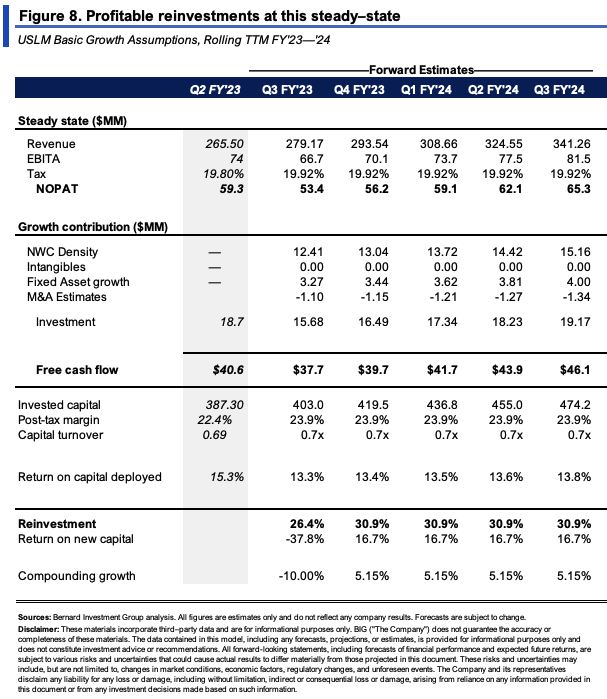
Valuation factors
A few things need to be considered in the valuation debate. The first is price and trend action.
Chart 1 below shows the weekly cloud chart, and where USLM trades in relation to key levels. After the sharp pullback in recent weeks, it still trades above the cloud, lagging line in situ. This is a bullish position to be in, and support remains at $166 on this setup.
Chart 1.
Data: Updata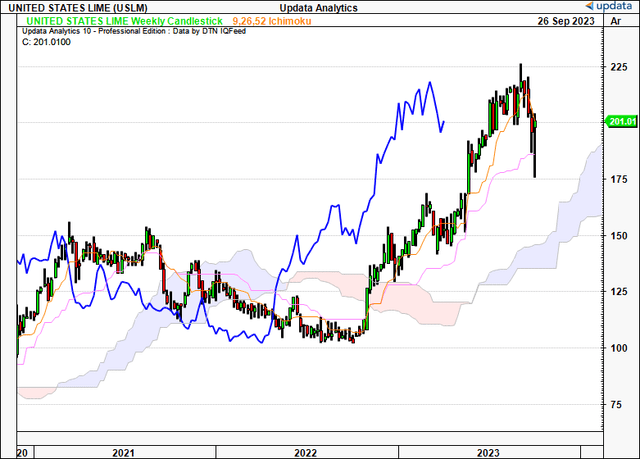
The daily point and figure studies in Chart 2 are also supportive. We have upsides to $228 and $234 on this, despite a $198 downside target. What’s clear, is a break to the upside is critical to see any validity in the $228 target. We are at the $199/share mark as I write, so I’d be looking for any evidence of support at these levels to indicate a continuation of the trend.
Chart 2.
Data: Updata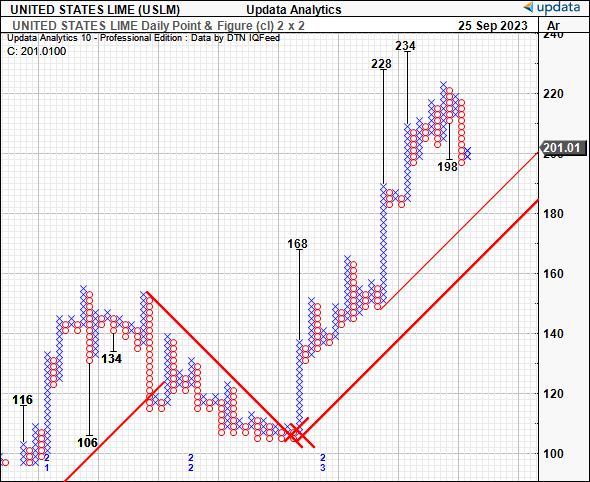
The stock also sells at 18x trailing earnings, at 13x EBIT, and 19x NOPAT, for a $1.14Bn market cap as I write (1,140/59.3 = 19x). The steady-state projections in Figure 8 project an average 16% growth in profit from incremental USLM’s investments. If it does hit this, you get to $68.8mm in implied NOPAT. Assuming the same 19x multiple, this derives a market value of $1.32Bn or $231/share.
Furthermore, first projecting the steady-state forecasts out to FY’28, then discounting at the 12% hurdle rate used here, arrives at an intrinsic value of $216/share.
BIG Insights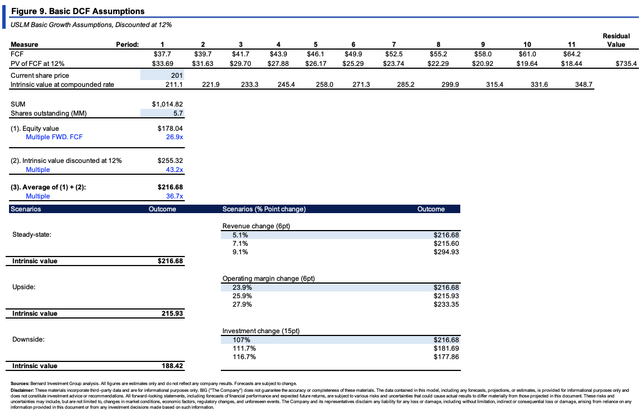
Figure 10 dictates the implied equity value by compounding intrinsic value at the function of its ROIC and reinvestment rate. As shown, the market looks to have been an accurate judge of intrinsic value. Should it hit the steady-state forecasts in Figure 8, it implies an intrinsic value of $1.32Bn, as mentioned earlier. To me this suggests ULSM has further to run.
BIG Insights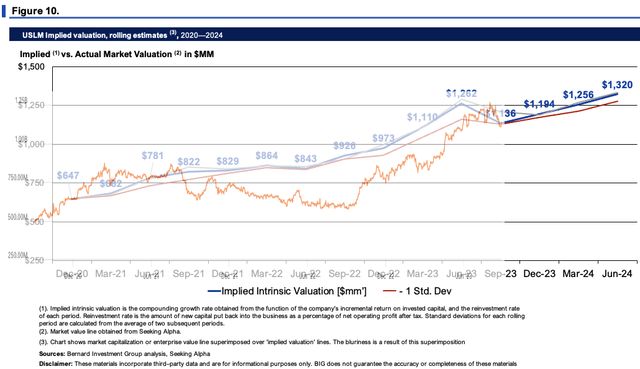
In short, there are multiple inflection points to consider in the USLM investment debate. These include (i) projected growth of the lime market, (ii) the company’s financials, (iii) economic value created for shareholders, (iv) supportive technicals, and (v) implied intrinsic valuations. Collectively, these are each bullish points that warrant a buy rating in my view. Net-net, rate buy at a valuation band of $216-$231.
Read the full article here


