Investment briefing
Shares of TFI International Inc (NYSE:TFII) have climbed a steady wall since the company listed on the NYSE back in 2020. Investors have rallied the stock 37% over the last 12 months at the time of writing, driven by a number of economic value factors.
For reference, TFII is a logistics and transportation company with its major operations in Canada and the U.S. TFII’s portfolio is built from wholly-owned subsidiaries in the packager + courier, less than truckload, truckload, and logistics markets. The company allocates capital towards each of its subsidiaries in order to grow its operations, but it also mines the M&A pipeline for bolt-on acquisitions to grow the whole company. It has a significant presence in both Canadian and U.S. markets, and boasts a sizeable trucking fleet of 11,754 trucks, 34,018 trailers, and 7,298 independent contractors at the end of Q2 FY’23.
In the investment context, there are many factors that appeal to the intelligent investor. TFII is a sensible company that is growing post-tax earnings at a decent clip, recycling capital back into the business at attractive rates of return. It throws off plenty of cash to its shareholders by way of earnings growth, dividends and buybacks. Despite a number of revenue downsides in its core segments in Q2 this year, it has maintained profitability as a function of capital employed and required to run the business.
This report will cover all of the moving parts in the TFII investment debate and link this back to the broader buy thesis. Net-net, I rate TFII a buy for the reasons outlined here today.
Figure 1.
Data: Updata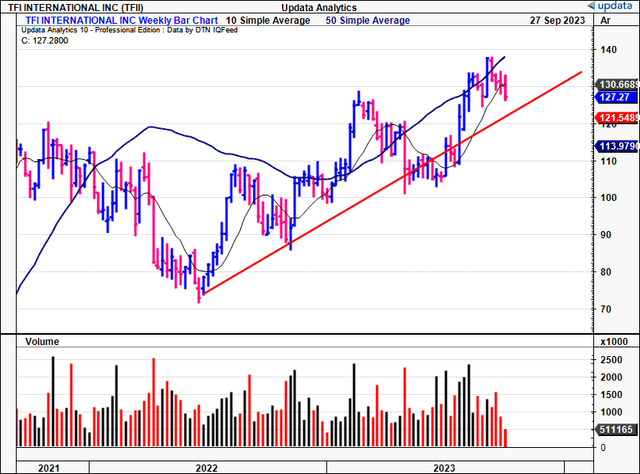
Figure 1(a). TFII Equity performance since listing in 2020
Data: Updata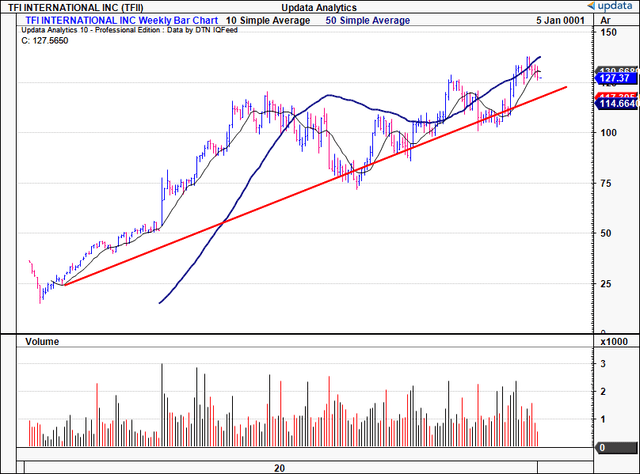
Critical investment facts underlining buy thesis
1. Revenue downsides across core business lines in Q2
TFII put up total revenues after fuel surcharges of $1.79Bn in Q2, down by 27% YoY. Meanwhile, revenue before fuel surcharge was $1.55B, down from $1.99B last year. The downsides were underscored by (i) softer demand in its end markets, and, more importantly, (ii) the divestiture of CFI’s truckload, temp control, and Mexican non-asset logistics business in August 2022. As a reminder, CFI produced $162.2mm in sales for the company in Q2 ’22, so this was a major reason for the pullback at the top-line. Management is eyeing $6-$6.50/share in earnings for FY’23, calling for $200–$225mm in CapEx, and to spin off $700—$800mm in FCF for the year. It also has $500mm in its acquisition pipeline. Acquisitions made this YTD are seen in Figure 2(a).
Moving down the P&L, operating income for the period was $192.4mm, down ~51% YoY. Again similar trends here—lower revenues, lower volumes, softer freight markets, and the CFI divestiture.
BIG Insights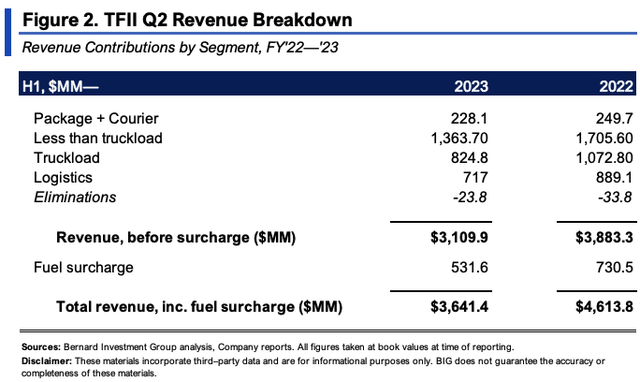
Consequently, revenue across all segments was each down YoY. Specifically, package and courier revenues fell by 15%, less than truckload (“LTL”) was down 27%, truckload by 32% (again, due to the CFI divestiture), and logistics came with a 20% lower clip. Namely:
- The LTL segment did $673mm of business. Critically, ground with freight Pricing (“GFP”) was down by 42% in the U.S. and 14% in its Canadian LTL operations. The decrease in US LTL revenue came from a 16.2% reduction in tonnage and a 4.6% reduction in revenue per hundredweight (note– this is excluding fuel).
- For the truckload business, it tallied $410mm in sales, down 27% YoY as mentioned earlier. Nothing really to add here, as this was primarily due to the impact of the CFI sale. It did, however, book $53.5mm from business acquisitions.
- In the logistics segment, revenue came in lower due to a $109 million, or 24% reduction in existing operations, along with $100.2 million due to a decrease in 3PL volume.
Despite the downsides across its core divisions, the CEO was optimistic on the call, putting it in plain English when asked about the industry:
[I]n terms of what’s going on in the industry…We’re looking at, it’s a very special situation. A few months ago, we were looking at it and saying, don’t know what’s going to happen there. And over the weekend, we were updated. Now, what I could say is that for sure, if I look at the average volume of TFI, TForce Freight division, okay, in the U.S. LTL prior to all these things going on right now, we were doing about 23,000 shipments a day, very steady since January of ’23. And then now, we’re running more like 26,000 shipments today lately.”
It’s also worth noting that TFII acquired Vedder Transportation group earlier this month. Financial details of the acquisition were not disclosed, but as part of the transaction, TFII acquired Vedder’s more than 155 tractors and c.300 tanker trailers. It will be folded into TFII’s specialized truckload division.
Vedder put up ~CAD$80mm in revenues last year, and has 13 terminals across the West of Canada, providing food-grade and dry-bulk transportation. It also has its footprint in dry van, flat deck, and super-b transportation. This strengthens TFII’s position in Western Canada, and adds to the buy thesis in my view. The full list of transactions TFII made in ’23 are listed in Figure 2(a).
BIG Insights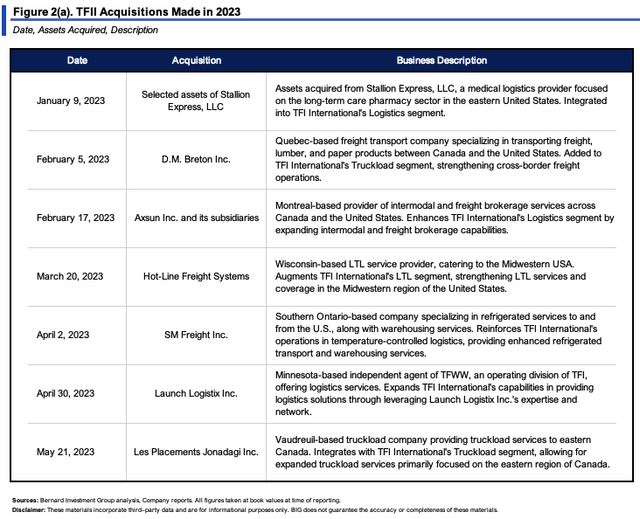
2. Economic value created from core operations
The following analysis illustrates the economic value TFII is creating for its owners on a sequential basis.
Figure 4 outlines the company’s gross capital productivity on a rolling TTM basis since 2020. It is taken as the TTM gross profit over total assets each period, all core and non-core assets included. The company rotated $0.30 per $1 in assets last period, off the $0.34 in 2022, but 43% higher than 2020. For reference, any number above $0.30 on the dollar is considered high.
BIG Insights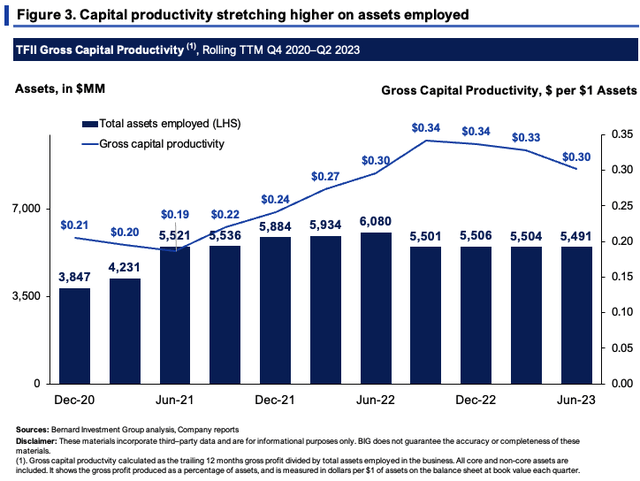
The company enjoys tremendous NWC efficiencies, namely:
- Each $1 invested toward NWC is recycled back to cash in a cash conversion cycle of just 13 days. It was down to 3 days across ’21.
- Most of the firm’s working capital is tied up in receivables. It has minimal inventories.
- This tells me its NWC requirements are reasonably low and that it can confidently grow without consuming piles of cash in the day-to-day operations.
BIG Insights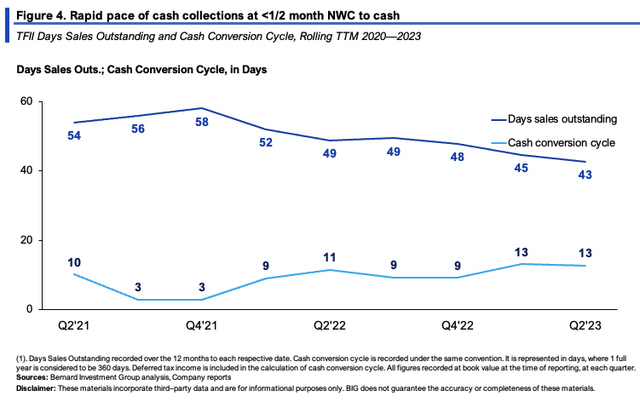
This flows into the value TFII is creating for shareholders. Critically, the firm is economically valuable in the following ways:
- TFII had invested $53.40/share to capital at risk and required to run the business, up from $33.8/share in 2020. The $53/share produced a post-tax earnings rate of $7.43/share, or 14% rate on capital.
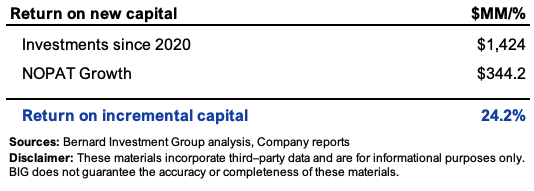
- Since 2020, it has invested an additional $1.42Bn into operations, most of was is in fixed assets (discussed later). These investments grew NOPAT by $344mm, a 24% incremental return on investment.
- The returns are driven via the ratio of sales to capital employed, producing 1.7x capital turnover last period. This tells me it employs a cost leadership strategy and prices its offerings below industry averages, and likely enjoys productivity advantages as a result.
Given the productivity of these assets, the company threw off $12.60/share in cash to its shareholders, including buybacks and all dividends paid up last period. This is up from $0.10 in Q2 FY’21, and flat with Q2 FY’22.
BIG Insights BIG Insights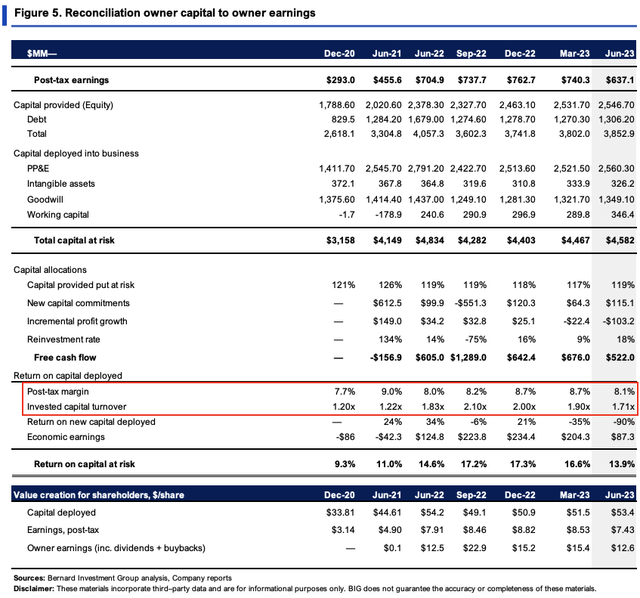
We employ a 12% required rate of return on all the capital in our equity holdings. Any NOPAT above this mark is considered economically valuable, and vice-versa. You can see in Figure 6 the company has thrown off $1.02–$2.71 in economic earnings over the last 2 years, at a margin of 1–2% of sales. Hence, at least 1-2% of sales is considered to be accretive to shareholder value in this instance. This adds to the buy thesis.
BIG Insights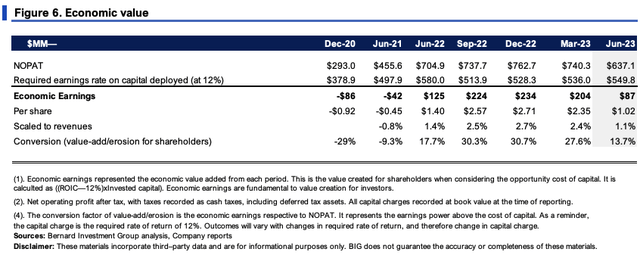
3. Forecasts + expectations at steady-state of operations
Related to the section above, TFII has grown the business with acceptable capital requirements. Figure 7 shows this pattern over the last 3 years.
Sales have grown at an 8% compounding rate on stable 10% operating margins. It has paid its fair share of tax as well. Critically, the investment requirements to grow are what stands out here:
(i). Each new $1 in sales took $0.35 of total investment across all sources (M&A has been lumpy, yet has also been a major source of capital allocation).
(ii). You can see the bulk of capital allocation has been towards fixed assets, squaring off with the economics of the business. As the business has grown, investment to fixed capital has increased $0.28 on the dollar, vs. just $0.09 on the dollar towards NWC.
BIG Insights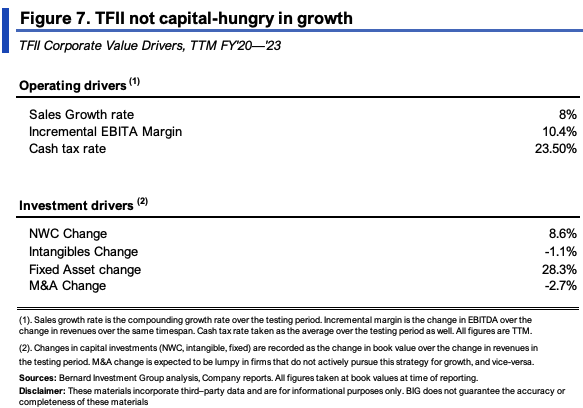
These are reasonable expectations to carry forward into FY’24 in my view. Consensus expects 7.3% revenue growth next year and ~6.5% the year after, and I am aligned with this view given what’s been discussed here. For it to hit a 7–8% growth rate going forward, I would project:
- Annual NOPAT to grow by ~$300mm to reach $835–$900mm on a 23% tax rate.
- TFII’s investment needs to range between $212–$284mm per quarter, $848–$1.13Bn annualized.
- That TFII could throw off $460–$615mm in FCF from these numbers, on a ROIC of 14–15%, reinvesting ~33–34% of earnings each period.
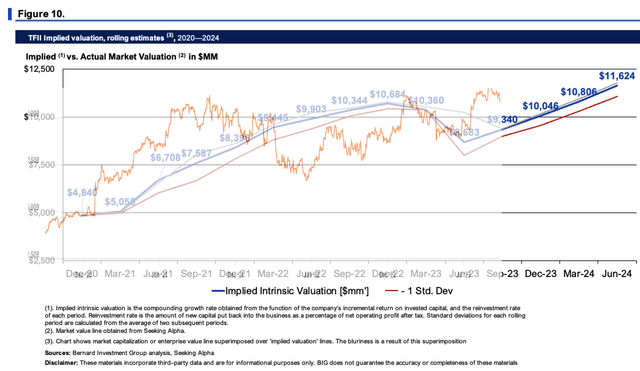
This sports a compounding growth rate of TFII’s intrinsic value of ~7.5% each period going forward from this model.
BIG Insights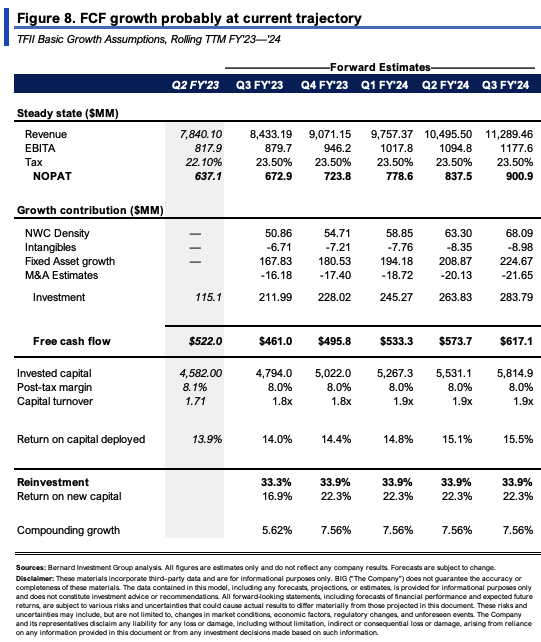
Valuation and conclusion
The stock sells at multiples of 19.4x forward earnings and ~16x forward EBIT. These are 14.5% and 7.3% premiums to the sector as I write. In effect, you’re being asked to pay around $16 for every future $1 in pre-tax income to buy TFII today. The question is what is on offer for this proposition. There is support for a future re-rating in the following ways:
- The PEG ratio is at 0.6x on a forward basis, factoring in the growth percentages projected in consensus estimates. That suggests you’re paying $0.60 for $1 of TFII’s forward earnings growth, a discount in my eyes.
- Projecting the firm’s steady-state assumptions from Figure 8 out to FY’28 and discounting back at the 12% hurdle rate arrives at an implied intrinsic value of $191/share, as seen in Figure 9. You can see the impact of various growth rates on the intrinsic value in Figure 9 under this model.
- Compounding the company’s intrinsic value at the function of its forecasted ROIC and reinvestment rates gets to an implied value of $135/share by Q2 FY’24, as seen in Figure 10.
Each of these factors supports a buy rating in my opinion. Long-term, I am eyeing the $191/share price target, looking for TFII to sport an 8% growth rate in FY’24 and throw off ~$500–620mm in FCF over the coming 18 months or so. Hence, in my view, it is worth paying 16x forward EBIT today
BIG Insights BIG Insights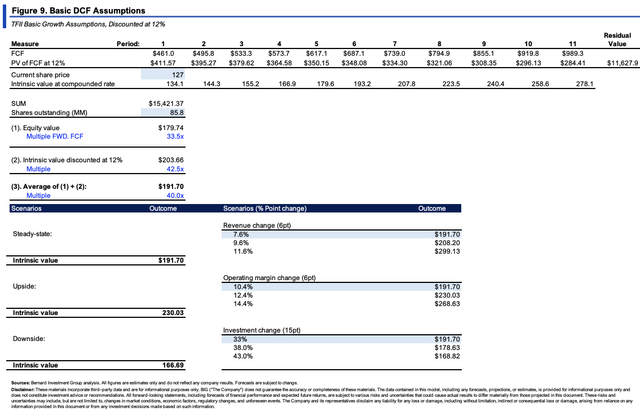
In short, TFII sports attractive economic characteristics that warrant a buy rating in my opinion. The company is throwing off piles of cash to its shareholders in terms of earnings, and also buybacks and dividends. It has a long reinvestment runway to deploy additional cash and is optimistic on industry trends going forward. Critically, suppose it were to maintain its current longer-term run rates. In that case, my estimates have the company valued at ~$191mm, considering the present value of forecasted FCFs in the modelling presented here today. Further, the company has grown its dividend each year since 2020, and that’s something to think of as well. Net-net, rate buy.
Risks to consider
The following investment risks should be considered:
- Fuel and operating costs continue to present challenges for logistics companies. Should oil and gasoline prices continue to rise, this could hinder TFII’s growth.
- The company pursues M&A as part of its growth strategy, and this could lead to inefficient allocation of capital.
- We cannot ignore the greater macro-level risks that are currently plaguing equity markets, namely, the inflation/rates axis, and aversion to risk assets. These could spill over into TFII’s share price and should be factored into all investment decisions.
Investors must recognize these risks in full before proceeding further.
Read the full article here


