
Snap-on Incorporated (NYSE:SNA) sells tools in a wide range of industries. The company has had a massive amount of operating leverage in the company’s long-term history as Snap-on’s margin has over tripled in the last twenty years. Although Snap-on’s financial history is extremely good, I only have a hold-rating for the stock as my estimates for the company’s future seem to be priced in. Also, as the company’s margins have reached a very high level, there can only be so much more space for the margin to grow.
The Company
Snap-on defines its offering as productivity solutions – the company sells simple tools, such as wrenches, drills, pliers. The company does also have more sophisticated products in its range of offerings.
Snap-on Q2 2023 Investor Overview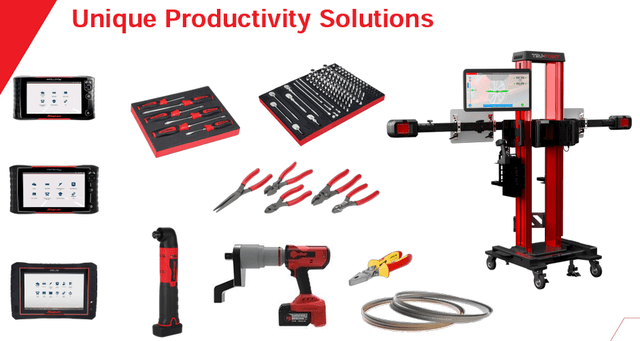
The company operates under numerous brands. Many of Snap-on’s brands are based on an automobile offering – Snap-on’s business as a whole has a good amount of revenues coming from the automobile industry. Snap-on’s brands include Snap-on, ATI Tools, AutoCrib, Bahco, Car-O-Liner, and Cartec, for example:
Snap-on Corporation’s Brands (snapon.com)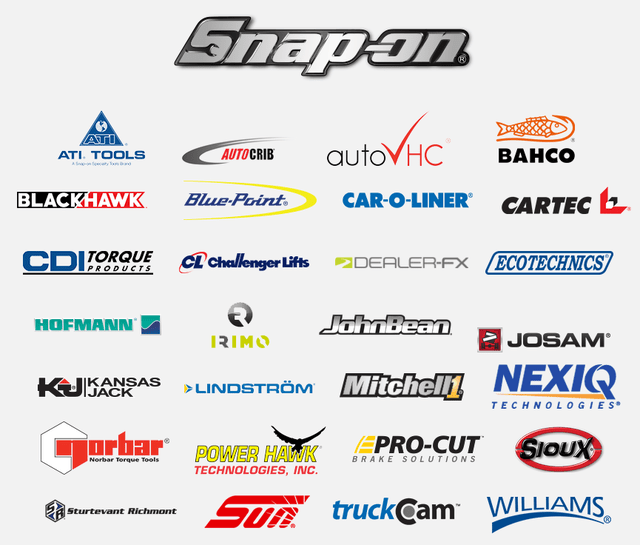
Snap-on’s stock price has appreciated at a CAGR of 8.6% in the past thirty years, and has had a modest dividend yield on top, with the yield currently standing at 2.56%.
30-Year Stock Chart (Seeking Alpha)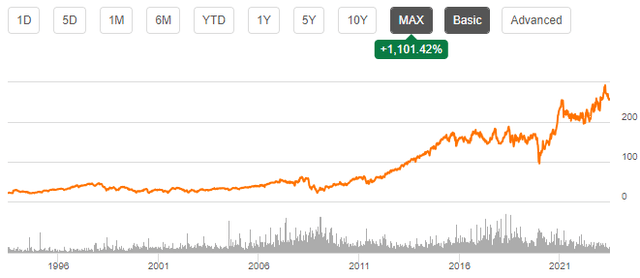
Financials
Snap-on has achieved a moderately good amount of growth in the company’s history, as the compounded annual growth rate has been 4.2% from 2002 to 2022 with quite low variance in the growth:
Author’s Calculation Using TIKR Data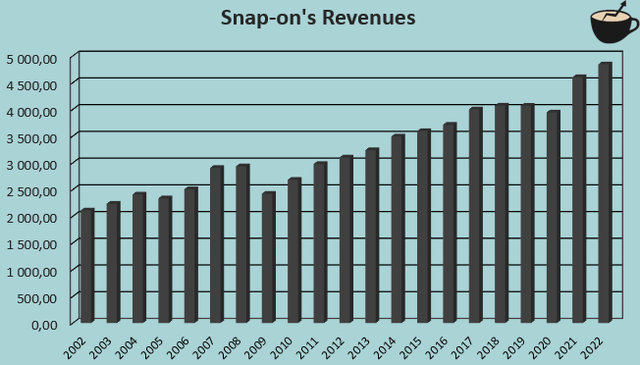
The growth seems to be mostly organic, although the company has had multiple small acquisitions to grow its list of brands.
Better than Snap-on’s revenue growth, the company has significantly grown its EBIT margin from a level of 7.9% in 2002 to a current trailing level of 26.2% – the company’s margin leverage has accounted for more of Snap-on’s long-term earnings growth than revenue growth, opposite to most companies.
Author’s Calculation Using TIKR Data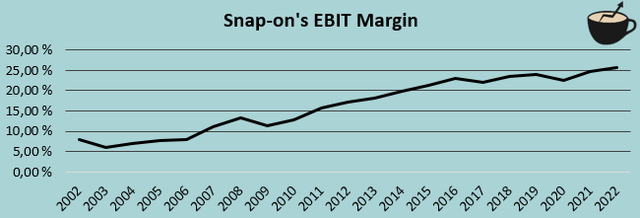
The question is – can Snap-on continue to have incredible operating leverage? Snap-on has already scaled its gross margin from 45.7% in 2002 to a current trailing level of 51.1%, and operating leverage in terms of OpEx should be nearing a ceiling. Currently, operating expenses including selling and general expenses represent only 24.9% of the company’s revenues – a company such as 3M, a leader in multiple verticals, has a opex-to-revenue ratio of 27.1%, above Snap-on’s.
Yet, operating leverage has continued in the first half of 2023 – the first half’s EBIT margin grew by a whole percentage point compared to the previous year’s period due to a higher gross margin. My approach to further margin expansion is to not expect it but to keep it in mind as a possibility.
Snap-on doesn’t seem to have significant interest-bearing debts on its balance sheet; almost all of the company’s debts seem to be operational in nature. On the other side of the balance sheet, Snap-on has quite a large amount of cash at $871 million – the cash balance leaves room for further small acquisitions or a good amount of share buybacks, for example.
Valuation
Currently Snap-on trades at a forward price-to-earnings ratio of 13.5, a bit below the company’s ten-year average of 15.4:
Historical Forward P/E (TIKR)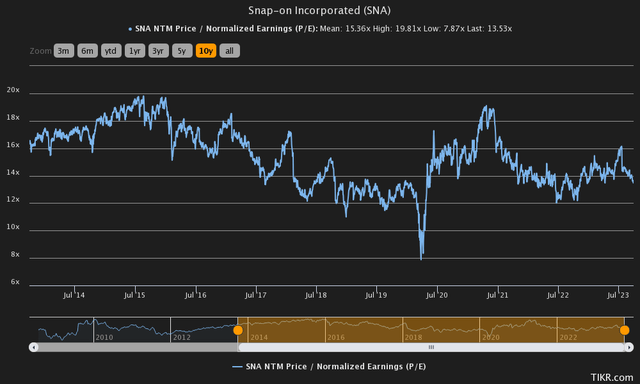
Taking the price-to-earnings ratio at face value, the ratio seems reasonable in the current climate for a company like Snap-on. As usual, I constructed a discounted cash flow model to take a deeper look into the valuation – it seems that the DCF model agrees that Snap-on is currently valued quite fairly.
In the model, I estimate a revenue growth of 5% for the current year, in line with analysts’ expectations. Going forward from 2024, I estimate a growth of 4.5% for 2024 that slows down into a perpetual growth rate of 2% in steps – the estimated rate is roughly in line with Snap-on’s organic history. As for the company’s EBIT margin, I expect only a slight further leverage. In the DCF model, the margin grows by 1.3 percentage points from 2022 to 2032 – if the company does demonstrate a margin expansion more in line with Snap-on’s history, the stock could be worth way more. I don’t think such leverage is a base scenario though, as margins are already on a very high level.
These estimates along with a weighted average cost of capital of 11.09% craft the following DCF model with a fair value estimate of $241.33, around 6% below the stock’s current price:
DCF Model (Author’s Calculation)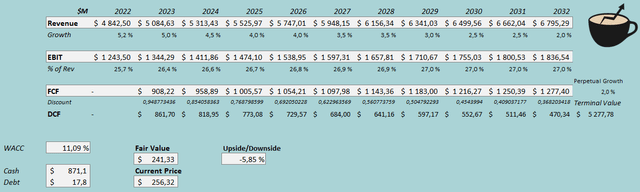
The used weighed average cost of capital is derived from a capital asset pricing model for Snap-on:
CAPM (Author’s Calculation)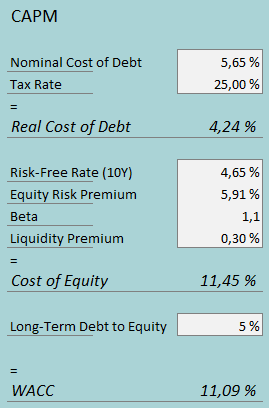
In the CAPM, I estimate Snap-on’s interest rate to be 5.65% – as the United States’ 10-year bond yield is 4.65%, I believe the estimate is reasonable as I added one percentage point into the yield. The company currently doesn’t hold a significant amount of interest-bearing debt – I believe that a good part of the company’s interest payments are related to leases and other mostly operational activities. For that reason, I estimate a low long-term debt-to-equity ratio of 5% for the company.
On the cost of equity side, I use the United States’ 10-year bond yield as the risk-free rate. The equity risk premium of 5.91% is Professor Aswath Damodaran’s estimate for the US made in July. Yahoo Finance estimates Snap-on’s beta to be 1.10. Finally, I add a very small liquidity premium of 0.3% into the cost of equity, crafting the figure at 11.45% and the WACC at 11.09%, used in the DCF model.
Takeaway
I believe that Snap-on is a fair investment at the current price. The company has achieved a remarkable long-term margin expansion, but the company needs to have further leverage for the stock to currently be undervalued in my opinion; as Snap-on’s margins seem to already pushed close to their limits, I wouldn’t think of significant further margin expansion as a base scenario. For the time being, I have a hold-rating for the stock.
Read the full article here

