The fair value for S&P 500 (SP500) is around 2800, which is 35% below the current level of 4300. There are three specific fundamental reasons that justify this forecast: 1) S&P 500 is overvalued based on the PE ratio, 2) bottom-up earnings estimates for 2024 are overly optimistic, and 3) the credit spreads don’t reflect the underlying credit conditions.
S&P 500 is overvalued
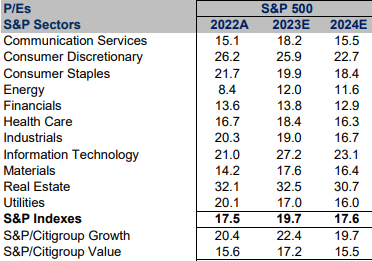
S&P 500 is currently trading at the PE ratio of 19.7x for 2023, which includes the actual earnings for Q1 and Q2 2023, and estimated earnings for Q3 and Q4 2023. Based on the historical average PE ratio of 15-16x, S&P 500 is already overvalued by at least 20%.
But there is considerable debate about what is an appropriate PE ratio, and even whether the PE ratio matters at all. It appears that investors don’t really understand what a PE ratio really is – and it’s definitely not some arbitrary number.
The PE ratio is a major fundamental valuation tool in two different ways. First, based on a simple cash flow discounted constant growth model, the PE ratio of 15x corresponds to an average GDP growth of 2-3% and a 2% inflation target – so that’s a starting point reflecting a “normal situation”. Thus, a PE multiple expansion reflects expectations of an above-trend growth. In other words, the expectation of a booming economy (earnings) justifies a higher PE ratio – the higher the growth expectations, the higher the PE ratio.
Second, the inverse of a PE ratio for S&P 500, or an EP ratio, is essentially an earnings yield, which can be directly compared to the general level of interest rates. Thus, when interest rates are extremely low, the PE ratio can be fundamentally justified at a higher level.
So, yes, there were periods of above-trend growth, boosted with globalization and innovations, which justified a higher PE ratio. Also, over the last 15-20 years interest rates were extremely low, which also justified a high PE ratio. Those days are gone – interest rates are rising and expected to rise, while the economy is expected to be stagnant. Thus, S&P 500 is facing a PE multiple contraction – which means at least 20% correction from the current levels.
CFRA 9/22
Earnings estimates are optimistic
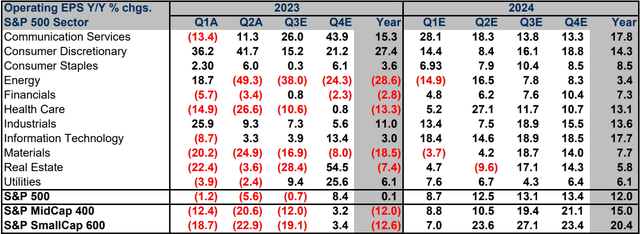
The PE ratio for S&P 500 at 19.7x for 2023 is based on expected earnings growth of 8.4% for Q4. Further the analysts expect 12% earnings growth for 2024. Obviously, these estimates reflect a booming economy in 2024, which potentially justifies a PE multiple expansion.
However, the best-case scenario for the US economy in 2024 is a soft landing, meaning either a very shallow and short recession, or just a barely positive growth. The Fed has indicated that it will hold the rates higher-for-longer, and that possibly the neutral rate has increased, and the Fed Chair Powell specifically stated that “the soft-landing is not a base case scenario”.
Thus, these overly optimistic estimated earnings estimates will have to be significantly downgraded. The best-case scenario of soft landing would likely push the S&P 500 down to the 3500 level, or to the November 2022 lows, as this would assume a very low earnings growth and a normal PE valuation metric.
However, a recession could result in around 20% earnings decline, from around $220/share to around $175/share – a 20% earnings drop is normal in a recession. If you assign a PE ratio of 16 to $175/share in earnings, you get the 2800 level for S&P 500.
CFRA CFRA

Credit spreads don’t reflect the reality
But what happens if there is a credit crunch in 2024, like in 2008, which causes a deeper recession, and forced selling, which could push the PE ratio below 15x?
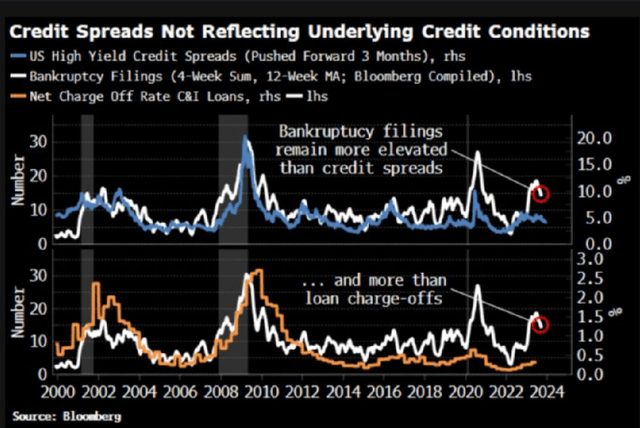
In fact, the credit spreads are currently very tight, suggesting virtually no credit risk in the system. However, the underlying credit conditions are much worse – and for some reason the credit spreads do not reflect this reality.
This is the chart posted by Muhamed El-Erian on LinkedIn. He points out that bankruptcy filings have spiked, while credit spreads have remained tight – this is a very unusual situation.
Bloomberg, Mohamed El-Erian
However, it was a very similar situation in 2007, credit spreads were also very narrow right before the 2008 GFC, and spiked as the economy entered a recession.
Thus, it is reasonable to expect that the credit spreads will have to widen as the economy weakens, or as the wave of refinancing in the CRE sector triggers a systematic credit crunch.
Obviously, a credit crunch would push the S&P 500 below the 2800 level, but at this point, I assume that a combination of the earnings contraction that’s less severe and also a less severe credit crunch would justify the 2800 level.
Implications
This analysis is objective and based on fundamentals that are easily observable. It is a fact that interest rates are much higher now, and it is likely to stay higher-for-longer given the inflationary forces from deglobalization. It is also a fact that the Fed has been tightening monetary policy, which will hit the economy with lags – the deeply inverted yield curve is likely to cause a recession, and there are plenty of vulnerable sectors, like CRE and regional banks that pose a systematic risk.
On the surface, the S&P 500 is a bull market, with (SPY) up by 12% YTD – and everything is fine. However, the equal-weight S&P 500 (RSP) is down for the year -0.02%. Dow Jones Industrials (DIA) is up YTD by 1.6%, while Russell 2000 (IWM) is up 2.5%. The point is that the broader market is flat for the year – we are not in a bull market.
Nasdaq 100 (QQQ) is up by 35% YTD – and that’s where the bubble is, the big tech, which is heavily weighted in S&P 500. Some analysts viewed this “inefficiency” from a different angle, they were buying RSP and IWM as a catch-up trade to QQQ. Based on the macro environment, it is more likely that QQQ will catch down, which is what will bring the S&P 500 down to the 2800 level.
Read the full article here


