Real Estate Weekly Outlook
U.S. equity markets declined for a fourth-straight week while benchmark interest continued an unabating resurgence to fresh multi-decade highs as a potential looming government shutdown, lukewarm economic data, and ongoing labor disputes added complications to existing “higher for longer” concerns. Following a promising start to the third quarter, optimism over a potential “soft landing” has been dimmed by resurgent oil prices – overwhelming fragile disinflationary tailwinds – and prompting central banks to stand firm in their commitment to restrictive monetary policy.
Hoya Capital
Posting its seventh weekly decline in the past nine weeks, the S&P 500 declined another 0.7% on the week, finishing the quarter near its lowest-levels since early June. However, the other major equity benchmarks achieved modest gains on the week, as the Mid-Cap 400 gained 0.3% while the Small-Cap 600 advanced 0.5%. Following steep declines last week, real estate equities remained under pressure amid concern that a “higher for longer” interest rate environment will spell more pain for private real estate owners and some lesser-capitalized public REITs. The Equity REIT Index declined another 2.3% on the week, with 17-of-18 property sectors in negative territory, while the Mortgage REIT Index dipped by 4.6%. Homebuilders declined 0.4% as mortgage rates surged to fresh 23-year highs, prompting a rate-driven slowdown that was already evident in sluggish New and Pending Home Sales data this week.
Hoya Capital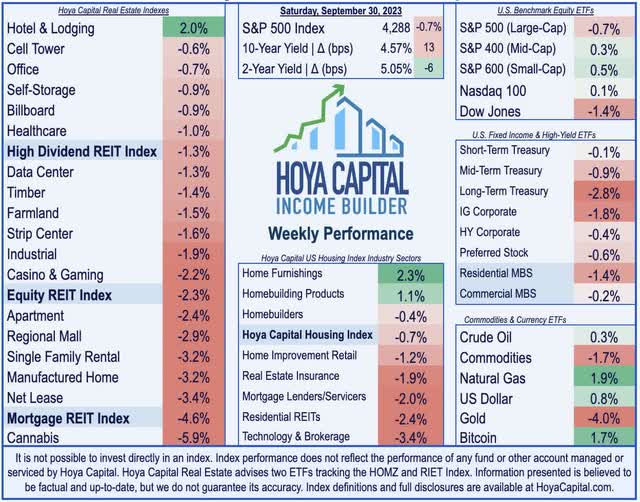
Positive catalysts have been increasingly sparse in recent weeks, lifting the Cboe Volatility Index (“VIX”) – also known as the Wall Street “fear gauge” – to the highest since late May. Oil prices – a key source of much of the recent dismay – continued their ascent today with Brent Crude hovering around $95/barrel as fresh Department of Energy (DoE) data showed that inventories of the Strategic Petroleum Reserve remained near 40-year low following a historically-large depletion in late 2022. Benchmark yields continued their ascent as well, with the 10-Year Treasury Yield swelling another 13 basis points to 4.57% – the highest end-of-week close since 2007 – while the U.S. Dollar posted an 11th straight week of gains. Complicating the economic outlook, a last-minute deal to avoid a government shutdown appeared unlikely by Friday’s close, while other closely watched negotiations between the UAW and automakers also yielded limited progress. Eight of the eleven GICS equity sectors finished lower on the week, with yield-sensitive sectors, including Utilities (XLU) and Consumer Staples (XLP) dragging on the downside.
Hoya Capital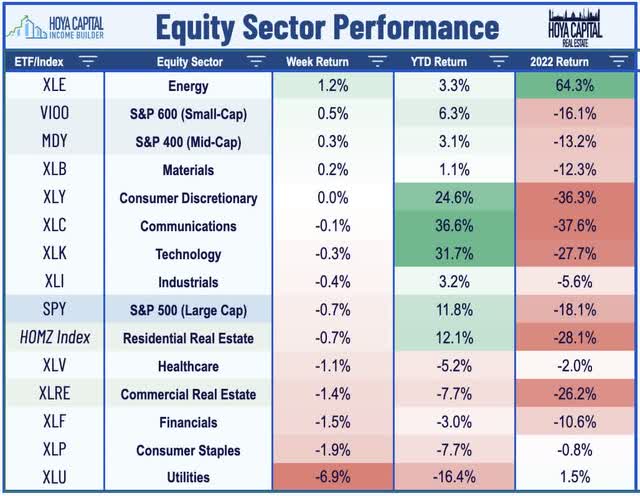
Real Estate Economic Data
Below, we recap the most important macroeconomic data points over this past week affecting the residential and commercial real estate marketplace.
Hoya Capital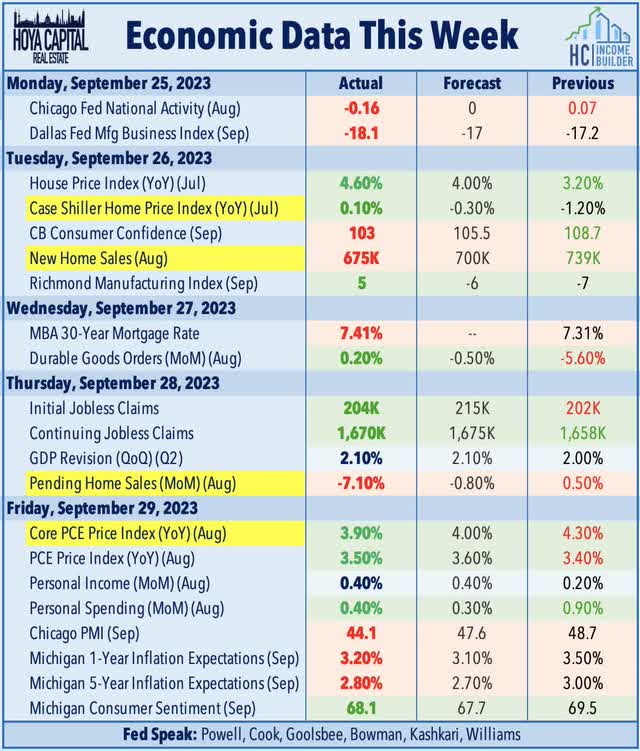
The closely-watched PCE Index this week provided further evidence that resurgent oil prices have negated the once-promising disinflationary tailwinds. The Personal Consumption Expenditures (PCE) Price Index rose 0.39% in August – the highest month-over-month increase since January – which pulled the year-over-year increase to 3.46%, a modest acceleration from July. Consistent with the trends observed in the Consumer Price Index, the Core metrics – which exclude energy and food prices – have remained on a promising trend, which will become even more pronounced in months ahead as the lagging shelter component begins to exert downward pressure on these price indices. The delayed recognition of shelter inflation has heavily distorted the headline and core metrics since 2021, resulting in a significant understatement of inflation from mid-2021-2022 and an overstatement of inflation since mid-2022.
Hoya Capital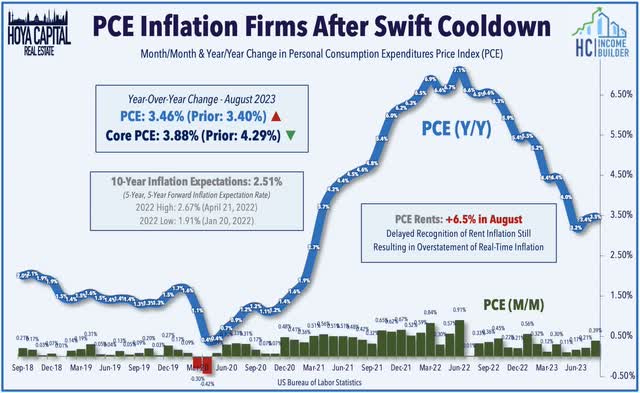
Pressured by a resurgence in mortgage rates to fresh twenty-year highs, data this past week showed that housing market activity has cooled once again over the past two months following a modest revival in late Spring and early Summer. New Home Sales fell more than expected in August, dipping 9% from last month to a seasonally adjusted annual rate of 675k. Pending Home Sales, meanwhile, posted a 7% decline from the prior month, slowing to the lowest-levels since 2020. Existing Home Sales data last week showed that sales of previously owned homes dropped to the slowest July pace since 2010, dipping to an annualized rate of 4.04 million, which was 15.3% lower than a year ago. According to Freddie Mac, the 30-year fixed-rate mortgage averaged 7.31% last week, which is now well above the prior November 2022 highs of 7.08%. Inventory levels have remained near historic lows, however, with just 1.1 million homes for sale at the end of August, which is the lowest since 1999.
Hoya Capital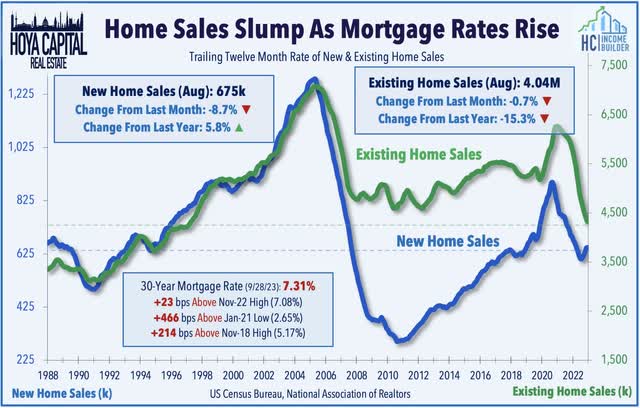
Limited supply – resulting in part from a “lock-in effect” on existing homeowners – has provided a floor for home values in the face of the stiff interest rate headwinds, and has helped to usher in a period of “normalization” in home prices after two years of unsustainable increases in 2021 and 2022. This week, the Case Shiller Home Price Index showed that home prices were roughly flat year-over-year in July, as prices rose modestly for a sixth straight month following a stretch of seven straight months of declines. The cooldown in home price appreciation is welcome and critically necessary to avoid a speculative bubble that was beginning to build – and the longer-term pain that would result from a period of significantly negative national home price appreciation. National home prices aren’t wildly out-of-line with personal income growth over long-term measurement periods. Depending on the measurement period, home prices are between 15% overvalued and 15% undervalued based on historical correlation with personal incomes, the most robust long-term predictor of price trends across time periods and regions.
Hoya Capital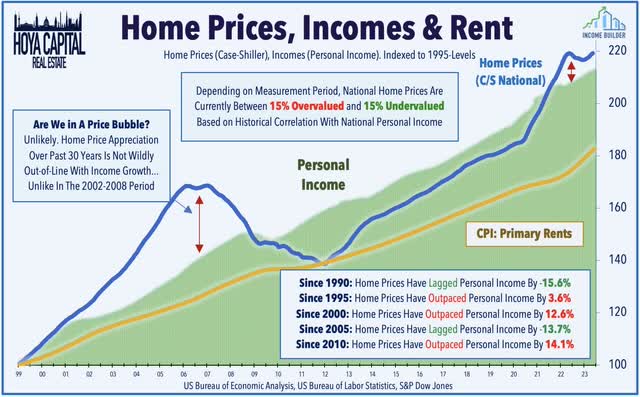
Equity REIT Week In Review
Best & Worst Performance This Week Across the REIT Sector
Hoya Capital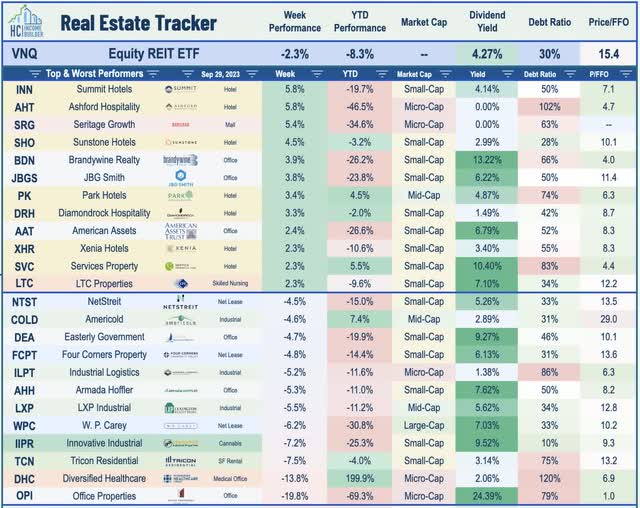
Office: West Coast-focused Hudson Pacific Properties (HPP) gained 2% this week following a resolution that ended the five-month Hollywood writer’s strike. HPP is among the largest owners of Hollywood studio space – representing roughly 10% of its NOI – the majority of which are operated under usage-based revenue models rather than long-term leases. BTIG upgraded HPP to Buy from Neutral, citing the ending of the strike, along with relatively solid pricing on HPP’s recent asset sales and improvement in office utilization rates in several West Coast cities. NYC-focused SL Green (SLG) was also among the leaders this week 4% after it announced that One Madison Avenue secured its Temporary Certificate of Occupancy, completing the development three months ahead of schedule. SLG received $577.4M in cash as the final equity payment from its joint venture partners, which SLG used to repay corporate unsecured debt. The 27-story, 1.4 million-square-foot office tower is one of two new “trophy” assets in Midtown NYC developed by SLG in the past several years, following the completion of One Vanderbilt in 2020. As noted in our office REIT report, the “flight to quality” trend has been evident in recent quarters as renewing tenants seek to take advantage of the soft market to “trade up” into higher-quality space, consistent with our view that the office sector shares many parallels with the retail space in the mid-2010s.
Hoya Capital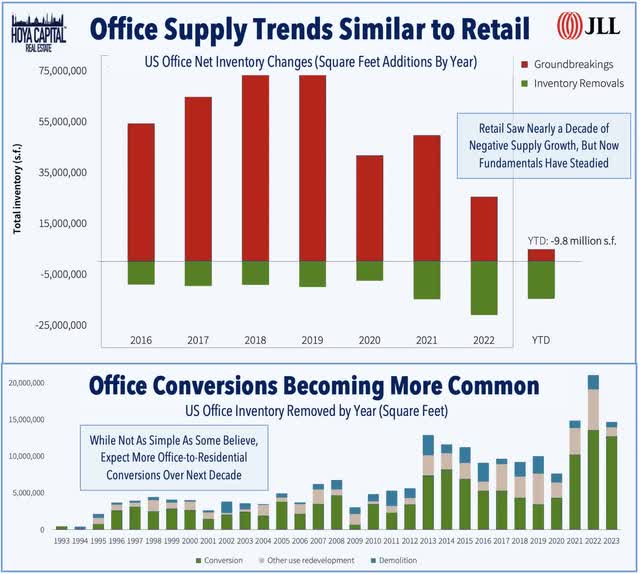
Net Lease: W. P. Carey (WPC) remained under pressure this week after additional analysts piled on the criticism of its announcement last week that it will spin-off its office assets into a separate externally-managed REIT as part of a “strategic exit from office” aimed at driving a “re-rating” of WPC’s stock price, which has traded at discounted valuations to similar-sized peers. This week, we published Net Lease REITs: Fighting The Fed, which discussed why these REITs have lagged in recent months as investors come to grips with a potential “higher-for-longer” interest rate environment. Thriving in the “lower forever” environment, the industry has been reluctant to acknowledge the higher-rate regime, keeping private-market values and cap rates stubbornly “sticky” and resulting in compressed investment spreads. Despite the tighter investment spreads, acquisition activity has slowed only modestly for some REITs – who have paid top-dollar for recent purchases – a strategy that could prove costly if rates remain elevated. Strong balance sheets and limited variable rate debt exposure had afforded these REITs the ability to be patient until the price is right, and while some REITs have exhibited prudence, others have plowed ahead with a “business as usual” approach or made seemingly unnecessary pivots, putting at risk decades of hard-fought progress.
Hoya Capital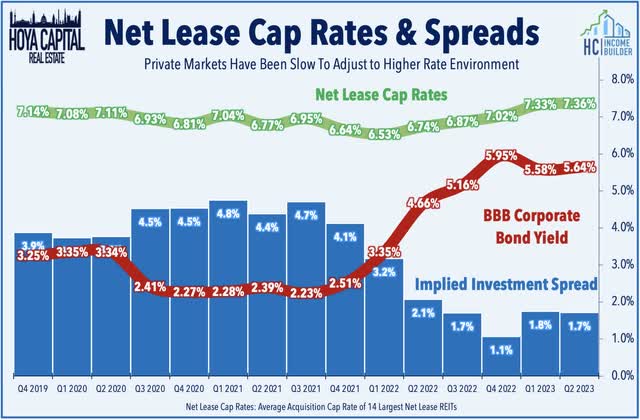
Single-Family Rental: Invitation Homes (INVH) – which we own in the Dividend Growth Portfolio – received a fresh Wall Street ‘Buy’ rating by UBS, with analyst Michael Goldsmith citing the rising demand for SFR rentals and a “long runway” for growth given the macroeconomic backdrop of a lingering housing shortage, aging millennials, and high cost of home ownership. UBS specifically likes INVH’s “infill product” – upper-end suburban neighborhoods – which it expects will see particularly limited supply growth, while its tenant base is positioned to absorb rent increases. One of the best-performing property sectors this year, Single-Family Rental REITs have rebounded as the dire predictions of a “hard landing” in rental markets have been rebuffed in recent months by steadying rental rates and strong occupancy trends seen across the major rent indexes. While multifamily markets face supply headwinds over the next year, single-family builders have pulled back from an already historically supply-constrained single-family market, fundamentals that support sustained inflation-beating rent growth. These REITs have played it safe – a privilege earned through disciplined balance sheet management – but tighter financing conditions will be a catalyst to drive further market share gains to larger institutions that have access to cheaper and deeper capital.
Hoya Capital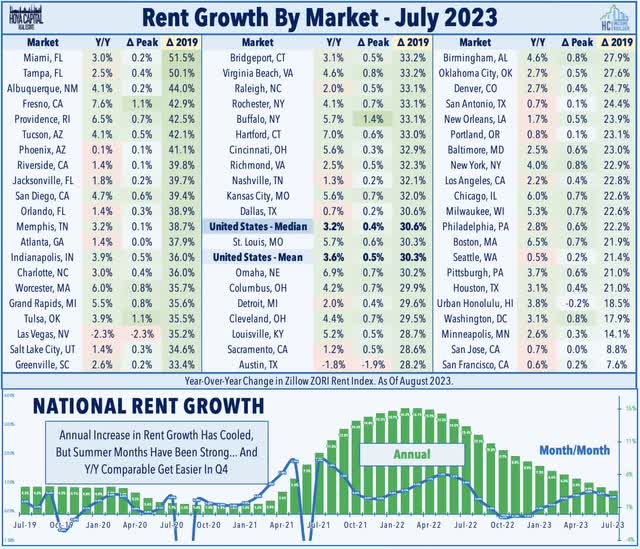
Healthcare: A pair of externally-managed REITs advised by RMR Group – Diversified Healthcare (DHC) and Office Properties Income (OPI) – traded sharply lower this week as both REITs announced Board and C-suite shakeups after their merger proposal failed to garner shareholder support. OPI announced the resignation and replacement of its Chief Financial Officer and appointed Christopher Bilotto – currently its Chief Operating Officer – as its new CEO. DHC, meanwhile, announced the resignation of two of DHC’s Board members who served on the DHC Board’s special committee in connection with DHC’s terminated merger plan and announced that B. Riley Securities has been engaged as its financial advisor to help it evaluate options to address near term capital needs including upcoming debt maturities. DHC also provided a business update, highlighting a continued recovery in its Senior Housing Operating Portfolio (“SHOP”). Comparable occupancy rates increased to 79.3% in August – up 30 basis points from July – which was still 720 basis points below the pre-pandemic 2019 baseline of 86.5%. Higher rents have helped to offset some of the relative occupancy declines, however, with DHC noting that comparable revenue was only 7.6% below 2019-levels. Last week in Healthcare REITs: Recovery and Relapse, we noted that Senior Housing has emerged as a leader in recent quarters as the long-awaited post-pandemic occupancy recovery is finally taking hold, but other sub-sectors have regressed of late amid a combination of macro and sector-specific headwinds.
Hoya Capital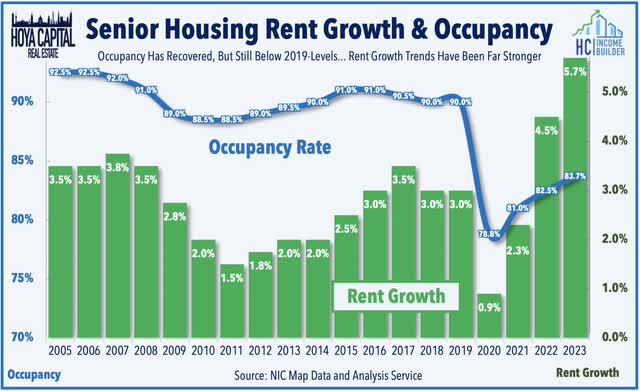
Mortgage REIT Week In Review
Mortgage REITs were under pressure for a second week amid a rebound in interest rate volatility, as the closely-watched MOVE Index jumped to one-month highs after calming to its lowest levels of the year in mid-September. The iShares Mortgage REIT ETF (REM) dipped 4.6% on the week, dragged on the downside by sharp declines from a handful of agency-focused residential mREITs amid pressure on residential mortgage-backed security (“RMBS”) valuations, with Annaly Capital (NLY) and Armour Residential (ARR) among the notable laggards. Newsflow was light this week ahead of the start of mREIT earnings season in mid-October. Invesco Mortgage (IVR) was among the better-performers after it held its quarterly dividend steady at $0.40/share (16.0% dividend yield). In our Earnings Recap, we noted that mREITs stand on steadier ground with dividend coverage after a relatively solid slate of earnings results showing a modest increase in earnings per share.
Hoya Capital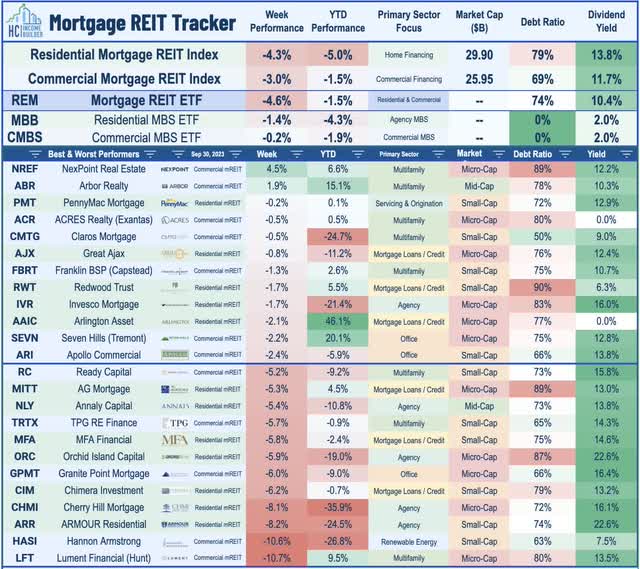
Book Values were in focus as the third-quarter wrapped up. Ellington Financial (EFC) slipped 3% after it announced that its book value per share was $14.30 at the end of August, down about 3% from the end of Q2. Spreads on mortgage-backed bonds (“MBS spreads”) – an important input into Book Value models – trended higher in the final two weeks of the quarter on the residential-side, but were little changed for commercial MBS. During the third-quarter, RMBS spreads widened by 9 basis points to 0.61%, while CMBS spreads narrowed by 2 basis points to 1.31%. While MBS spreads were generally steady during the quarter, benchmark interest rates – the other critical input affecting Book Values – have increased significantly during this period, with the 2-Year Yield jumping by 17 basis points. The iShares MBS ETF (MBB) – an un-levered benchmark tracking RMBS valuations – declined 3.7% during the quarter, while the iShares CMBS ETF (CMBS) posted declines of 1.2%, indicating downward pressure on mREIT Book Values in Q3.
Hoya Capital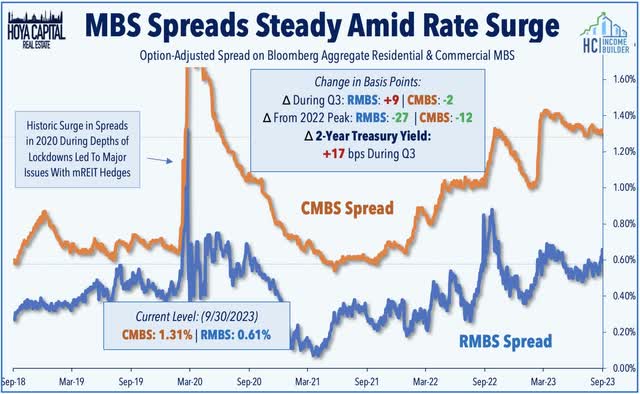
2023 Performance Recap & 2022 Review
At the end of the third quarter, the Equity REIT Index is lower by 8.3% on a price return basis for the year (-5.9% on a total return basis), while the Mortgage REIT Index is lower by 0.1% (+4.9% on a total return basis). This compares with the 11.8% gain on the S&P 500 and the 3.1% advance for the S&P Mid-Cap 400. Within the real estate sector, 4-of-18 property sectors are in positive territory on the year, led by Data Center, Single-Family Rental, Healthcare and Industrial REITs, while Net Lease and Cell Tower REITs have lagged on the downside. At 4.57%, the 10-Year Treasury Yield has increased by 69 basis points since the start of the year – up sharply from its 2023 intra-day lows of 3.26% in April – and now hovering at 15-year highs . Following the worst year for bonds in decades, the Bloomberg US Bond Index is lower again this year, producing total returns of -1.2% thus far. WTI Crude Oil – perhaps the most important inflation input – is higher by 15% this year but remains roughly 15% below 2022 peaks.
Hoya Capital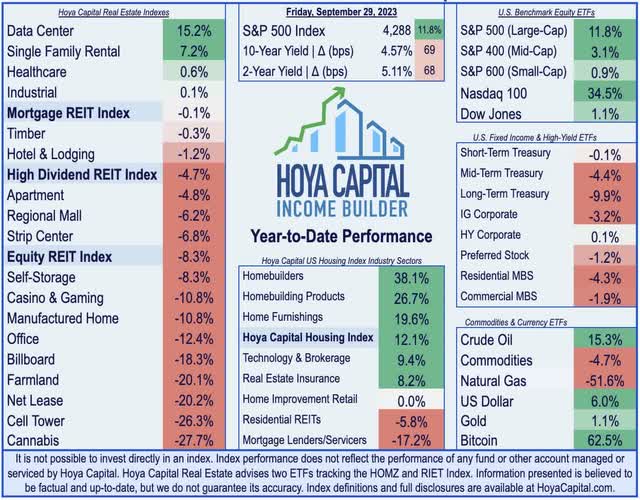
Economic Calendar In The Week Ahead
Employment data highlights another critical week of economic data in the week ahead – but several of the reports would be delayed in the event of a government shutdown. The major report of the week – which would indeed be affected by a shutdown – comes on Friday with the BLS Nonfarm Payrolls, which is expected to show job growth of 165k in September, a moderation from the 187k in August. The closely-watched Average Hourly Earnings series within the payrolls report – which is the first major inflation print for September – is expected to show a continued moderation in wage growth to 4.3%. Wage growth slowed to 4.28% last month, the slowest since June 2021. Earlier in the week, we’ll see JOLTS data on Tuesday, ADP Payrolls data on Wednesday, and Jobless Claims data on Thursday – of which the ADP report would be the only release unaffected by a shutdown. ‘Good news is bad news’ will likely be the theme of these reports as several Fed officials have pinned their decisions to pivot away from aggressive monetary tightening on a long-awaited cooldown in labor markets. We’ll also be watching Construction Spending data on Monday, the OPEC meeting on Wednesday, and Purchasing Managers’ Index (“PMI”) data from both ISM and S&P.
Hoya Capital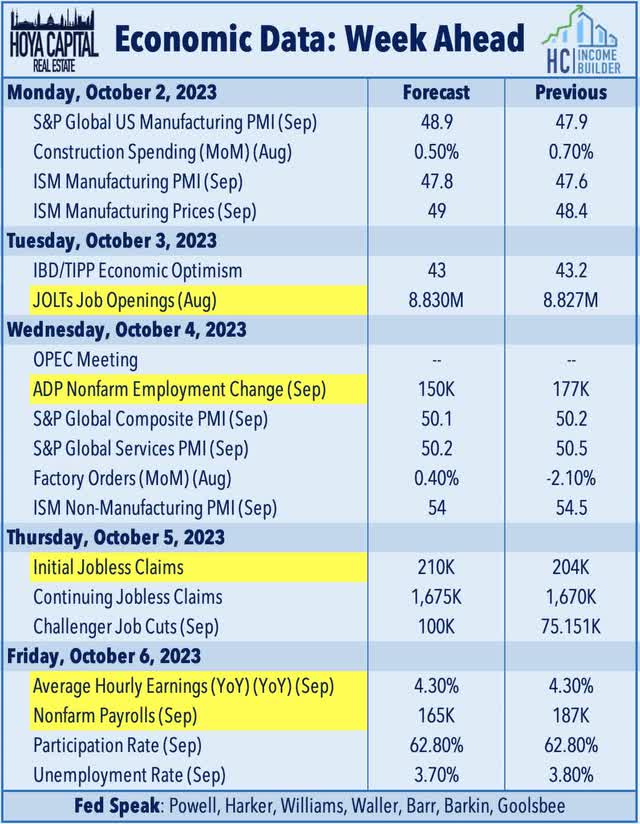
For an in-depth analysis of all real estate sectors, check out all of our quarterly reports: Apartments, Homebuilders, Manufactured Housing, Student Housing, Single-Family Rentals, Cell Towers, Casinos, Industrial, Data Center, Malls, Healthcare, Net Lease, Shopping Centers, Hotels, Billboards, Office, Farmland, Storage, Timber, Mortgage, and Cannabis.
Disclosure: Hoya Capital Real Estate advises two Exchange-Traded Funds listed on the NYSE. In addition to any long positions listed below, Hoya Capital is long all components in the Hoya Capital Housing 100 Index and in the Hoya Capital High Dividend Yield Index. Index definitions and a complete list of holdings are available on our website.
Hoya Capital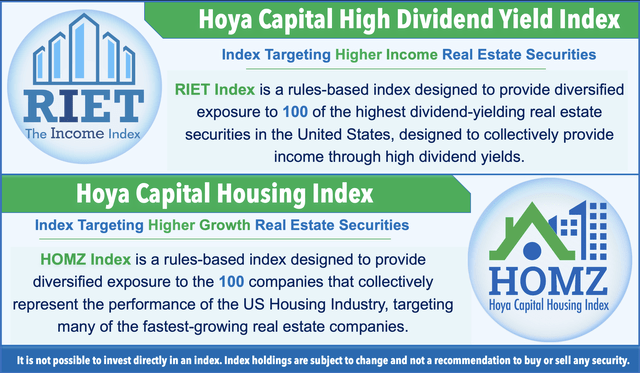
Editor’s Note: This article discusses one or more securities that do not trade on a major U.S. exchange. Please be aware of the risks associated with these stocks.
Read the full article here


