
Summary
I find the SPDR S&P Semiconductor ETF (NYSEARCA:XSD) ETF compelling due to its broader and more equal weight focus of the semiconductor sector. Unlike iShares Semiconductor ETF (SOXX), which I covered recently, the XSD has greater upside potential on lower relative valuation. While its holdings do not escape the 2023 downturn, many have strong consensus EPS growth for YE24 (45%) and YE25 (53%) that combine with a PE of 24x and consensus price target upside of 35%.
Key to the XSD fund is that it tracks the S&P Semiconductor Select Industry from the S&P Total Market Index i.e., it’s far broader than the S&P 500 (SPX). The average weight is 2.6% with mega cap Nvidia (NVDA) at only 2.8%. This ETF includes and gives a larger ponderation to small cap stocks.
SPDR Index for XSD (Image from SPDR)
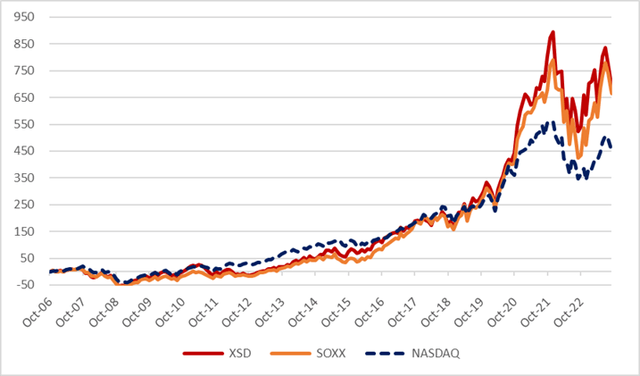
Performance has been very good. Since inception it is up 580% and has beaten the NASDAQ (NDX) handsomely. In addition, this ETF has kept pace with bigger caped focused funds as well.
XSD Performance vs Select Peers (Created by author with data from Capital IQ) XSD Performance Since Inception (Created by author with data from Capital IQ)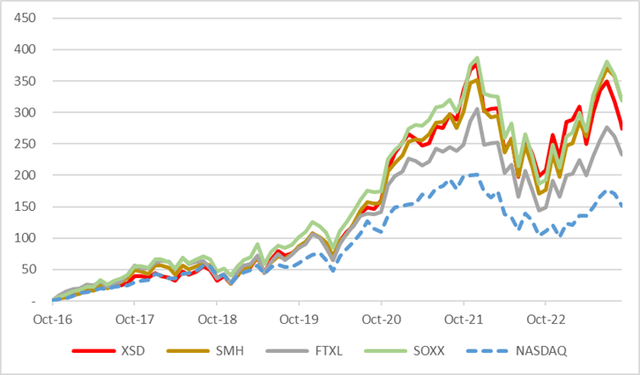
Looking Under the Hood
To better gauge the upside potential and the fundamentals of the ETF I utilized individual consensus estimates for 40 stock or 99% of the portfolio. I calculate weighted growth, PE and relative valuation (PEG). This exercise also serves to identify outliers that maybe of interest as individual positions.
As can be seen in the table below, XSD has a consensus weighted upside potential of 35% and an average of 37% to YE24. There are 10 stocks with circa 50%+ upside according to analysts. indie Semi (INDI) has 144% upside potential and is focused on AI/Autonomous sensors.
XSD Consensus Portfolio Upside (Created by author with data from Capital IQ)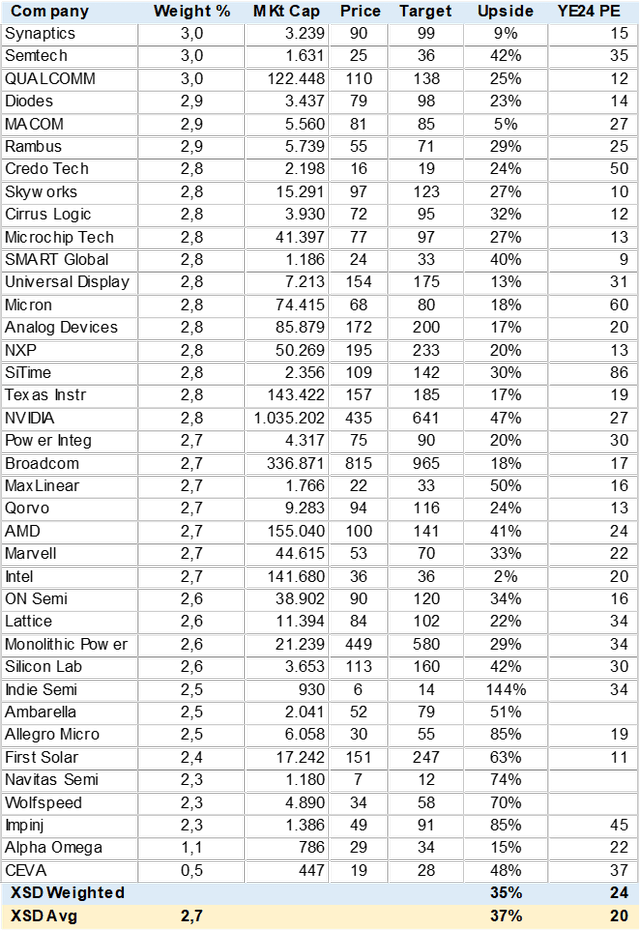
Growth Outlook
I calculated EPS growth for YE23 to YE25 using consensus estimates. Many companies are expected to post declining or negative earnings in YE23, and the ETF portfolio points to a 25% EPS reduction. For YE24 and YE25 analyst expect a sharp increase, up 45% and 53%.
However, this may be more an optical illusion than fundamental growth for many companies as they regain what was lost in YE23. Hence, I compared YE25 EPS in absolute terms to YE22 EPS. If a company has ratio of 1 or less this means it has not yet reached YE22 earnings levels by YE25, which is not a good sign and may not warrant a high valuation. About 40% of the portfolio falls into this category. “Real” high growth stocks seem to be First Solar (FSLR), Credo Tech (CRDO) and Impinj (PI) as well as NVIDIA.
XSD Consensus EPS Growth (Created by author with data from Capital IQ)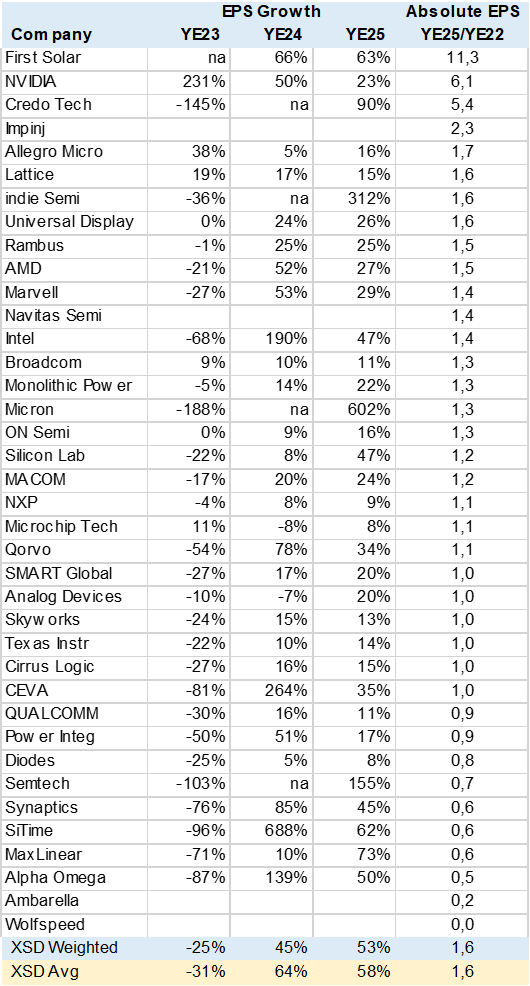
Valuation
Using consensus estimates I calculated a relative valuation using the PEG method or PE to EPS growth. The rule of thumb is that a PEG of 1 or less indicates a cheap valuation. The problem one faces using this method is how many years of growth to use to fairly value the stock. A recuperation year or moving from loses to lower loses may greatly distort the outcome. One needs to scrub or adjust the data.
The ETF portfolio has a PEG of .9 and .7 for YE24 and YE25 respectively. Quite solid relative valuations adjusted for volatile EPS growth. I also calculated the implied PE target from consensus price targets. Most analyst use 12month or YE24 price targets, but others, for stocks with longer earnings ramp up may use a YE25 EPS to derive a target price. While a P/Revenue is still used for stock with loses. As can be seen the “fair” PE for the ETF is 29x on YE24 EPS. In my view reasonable relative to growth.
XSD Consensus Relative Valuation (Created by author with data from Capital IQ)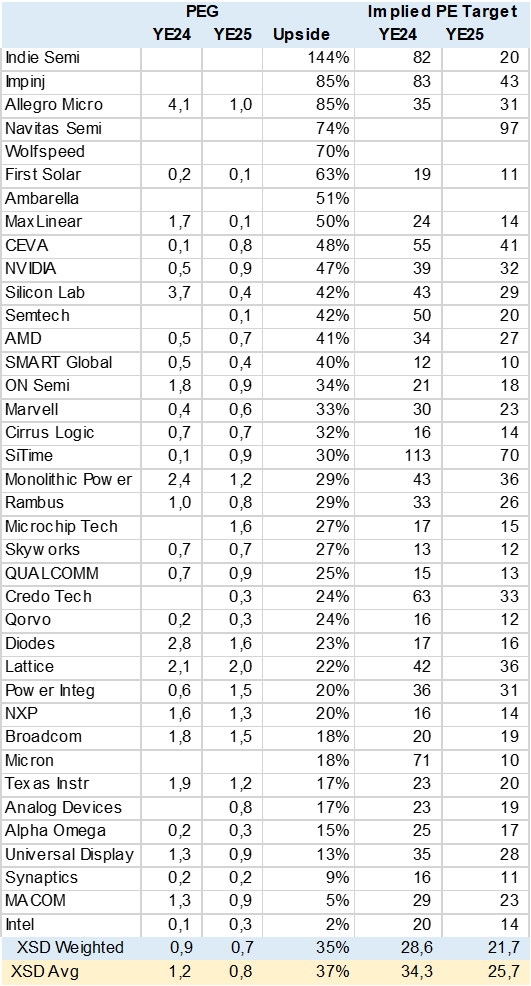
Conclusion
I rate the XSD a buy as its broader and more equal exposure to the semiconductor sector, that includes some small caps, seems to provide high upside potential with a relatively inexpensive valuation, according to consensus estimates.
Read the full article here

