
Last week’s article attempted to answer the question “is the bottom in?” and concluded in all likelihood it wasn’t: “the weak September close and the usual pattern of a lower low in October means a drop to 4200 at the 200dma and the break-out area is more probable.”
The S&P500 (SPY) has now made a lower low to 4216, with futures striking the 200dma at 4201 on Wednesday morning. This was followed by a strong Friday reversal as the headline NFP number smashed the 171k estimate with a print of 336k. When markets stop going down on ‘bad’ new (or news expected to have a negative effect) it can signal a significant change. But was Friday’s move enough to flip the view back bullish?
In an attempt to answer this, various tried and tested technical analysis techniques will be applied to the S&P 500 in multiple timeframes. The aim is to provide an actionable guide with directional bias, important levels, and expectations for price action. The evidence will then be compiled and used to make a call for the week(s) ahead.
S&P 500 Monthly
The weak September bar has been swiftly “repaired” with October’s lower low and recovery. This is how reversals develop as there is now evidence of demand. It is the same pattern as September/October 2022, 2021 and 2019, all of which went on to further gains.
However, it is premature to get bullish. The first significant level of 4325 has yet to be re-taken, and 4324 marked Friday’s high. Price needs to break and hold above 4325-4335 to be confident the low is in.
SPX Monthly (Tradingview)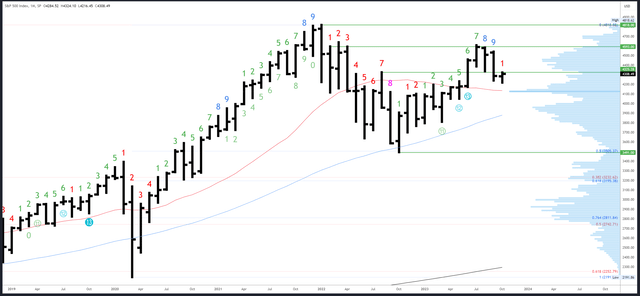
Monthly resistance is the broken support of 4325-4335, then 4593-4607.
4195 is the first support, with 4140-50 an important level at the 20-month MA and the high volume node (also the centre of the 3491-4818 range).
The September bar completed a Demark upside exhaustion count. This is having a clear effect and the weakness can persist over several bars (months). It will take at least 9 months for another count to complete.
S&P 500 Weekly
This week’s price action was more constructive with a test of the channel leading to a higher close. Again, this is a good start for a reversal, but it stayed below the 4338 high of the previous week; there is not yet evidence of demand at higher prices.
SPX Weekly (Tradingview)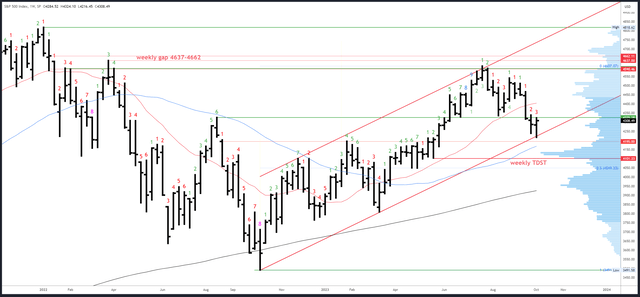
4325-35 is the first resistance, then 4430. The 20-week MA is also worth noting as it is at 4400 in confluence with a daily gap fill.
Potential support is at the weekly low of 4216, with the 4195-200 break-out area just below. The 50-week MA will be at 4178 next week.
A downside (Demark) exhaustion count will be on bar 4 (of a possible 9) next week.
S&P 500 Daily
This week’s low of 4216 missed the 200dma by 14 points. Obviously, we can’t expect levels to be tagged perfectly, especially when significant releases like NFP are involved, but it does leave the technical picture in some doubt – will it be tested at a later date or not?
The situation is made more uncertain by the futures chart which dropped to 4201 on Wednesday morning and reversed off the 200dma. Was this a sneaky bottom while the US slept?
Perhaps, but like the monthly and weekly charts, the daily chart did not break any key resistance points during Friday’s rally. Indeed, it stalled at the daily down channel. Without a sign of actual strength, we can’t be sure if Friday’s rally was just a short squeeze as NFP traders were caught selling the lows on the strong headline number.
SPX Daily (Tradingview)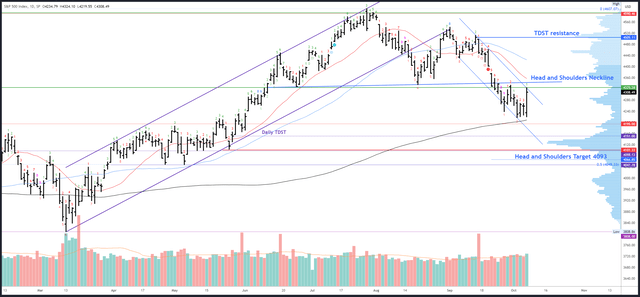
Initial resistance is at the near-term channel. This is at 4324 and declining 10 points each session. 4345 is key resistance at the head and shoulder neckline, followed by the 4375-4400 gap and 4505.
Potential supports are 4216, then the 200dma at 4208, and finally TDST at 4151.
Friday’s rally interrupted the downside (Demark) exhaustion count. A new upside count is underway and will be on bar 2 (of a possible 9) on Monday. This means no reaction is expected next week.
Events Next Week
NFP was a mixed bag – a huge headline beat, a wage growth miss and weak data from the household survey (following a weak ADP). Yields gave back most of the initial rally, but the 30Y still made the highest close of the week on Friday. Furthermore, the odds of a November hike jumped to 73%. The market still clearly believes in ‘higher for longer,’ despite what equities did on Friday.
Saying all that, the bond market will be closed on Monday for Columbus Day. Moreover, NFP could be quickly overshadowed by the events in Israel over the weekend. This will dominate headlines and surely lead to a Monday gap down. However, this is likely a short-term reaction (assuming the official participants don’t spread beyond Israel and Hamas); surprise negative news always leads to a complete recovery, often within days. I wrote an article on this subject back in 2017 and I think it still rings true.
Inflation data will be in focus with PPI released on Wednesday and CPI on Thursday. Hot readings would push the odds of a November hike even higher.
Probable Moves Next Week(s)
The bigger picture view still hangs in the balance. Bears were in control last week and fumbled at new lows. The bulls now have the ball, but are yet to score a point. This can all change next week if there is a break above 4345 and strong weekly close (near the highs of the weekly range). I never work in absolutes, but if this were to happen I’d be almost certain the low is in, especially given the weekend news.
Shorter-term, the view seems clear. Friday’s rally bumped into resistance and is short-term oversold. Coupled with the troubling news out of the Middle East over the weekend, an early week dip looks likely. This could retrace a good portion of Friday’s rally, with 4260-70 (61.8% Fib and origin of the post-NFP move) a likely target. Bears will be feeling confident again, but a positive reaction from this area could set the low of the week and lead to a decisive bullish rally.
A weak close below 4260 would increase the odds of further lows and put 4195-4200 within reach. As long as this area leads to a recovery back over 4216, I will continue to look for a Q4 rally and safe ways to position for it. If it doesn’t, and there is a weekly close below 4200, I will stay out of the market, repeat my process and re-assess.
Read the full article here

