
Last weekend’s article was titled “Bulls Have the Ball,” and this was certainly the case for the S&P 500 (SPY) in the first half of the week. Monday’s recovery and higher close were key and followed the expectations set out for a counter-intuitive move following the Israel news: “4260-70…could set the low of the week and lead to a decisive bullish rally.” The futures low came at 4269.9.
The second half of the week shifted bearish and Friday’s action was even more counter-intuitive than Monday’s. Oil, gold and the VIX all surged higher as Israel did exactly what everyone expected and launched a ground offensive. Stock markets closed the week on the back foot with bulls looking vulnerable again.
This week’s article will focus on whether the S&P500 is likely to continue the current dip and whether it is a buying opportunity. It will also address what a break of the 4216 low would mean for the bigger picture view. Various technical analysis techniques will be applied to the S&P 500 in multiple timeframes. The aim is to provide an actionable guide with directional bias, important levels, and expectations for future price action.
S&P 500 Monthly
October’s lower low and recovery back into September’s range is positive action and has set up a potential reversal. It is the same pattern as September/October 2022, 2021 and 2019, all of which went on to further gains.
The first significant level of 4325 has now been re-taken, although we can’t read too much into this yet as there are two full weeks to go until the October close.
SPX Monthly (Tradingview)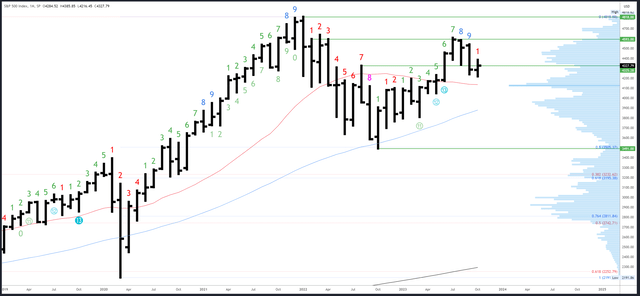
Monthly resistance is the broken support of 4325-4335, then 4593-4607.
4195 is the first support, with 4140-50 an important level at the 20-month MA and the high volume node (also the centre of the 3491-4818 range).
The September bar completed a Demark upside exhaustion count. This is having a clear effect and the weakness can persist over several bars (months). It will take at least 9 months for another count to complete.
S&P 500 Weekly
This week’s bar built on the potential of the previous week’s reversal with a higher high, higher low and higher close. A stronger close near the highs of the weekly range would have underscored the bullish view and projected imminent continuation, but Friday’s weak action took the shine off.
SPX Weekly (Tradingview)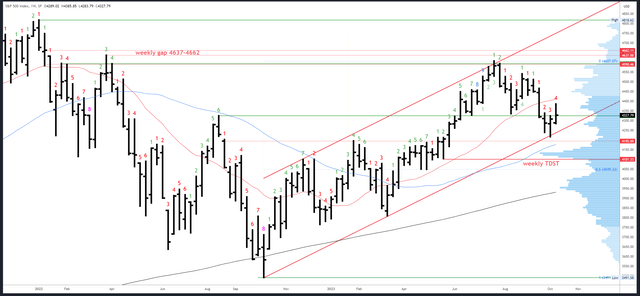
4325-35 is still an area of interest but was pushed through last week so is no longer strong resistance. 4430 is the next weekly resistance.
The first potential support is at the weekly low of 4283, with 4195-4216 a wide area of interest below. The 50-week MA will rise to the low 4180s next week.
A downside (Demark) exhaustion count will be on bar 5 (of a possible 9) next week.
S&P 500 Daily
The high of the week didn’t come from a monthly or weekly level, but from the daily gap. I left a comment on Tuesday warning the “next test is the gap above 4375” and the rally soon stalled and eventually reversed from 4385 on Thursday. This was on heavier volume and followed through on Friday which gives the chart a near-term bearish bias. However, given the positive context from the monthly and weekly charts, any dip is likely to make higher lows with 4216. A new low at this stage would have longer-term bearish implications.
SPX Daily (Tradingview)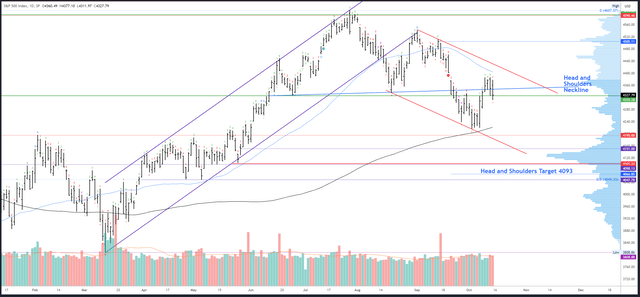
Minor resistance starts at the 4385 high up to gap fill and the 50dma in the 4400 region, with the red channel also in play just above. A break of the channel would provide further evidence the low is in and target 4505.
Initial support is Monday’s 4283 low. 4216 is now in confluence with the 200dma and is a make or break level. 4151 is the next support below.
Friday’s decline interrupted the upside (Demark) exhaustion count. A new upside count is underway and will be on bar 2 (of a possible 9) on Monday. This means no reaction is expected next week.
Events Next Week
The conflict in Israel will continue to dominate headlines and it looks like the markets positioned for more negative news over the weekend. While there is little chance of anything positive happening, if the news is not as bad as feared markets could bounce on Monday.
Next week is the last chance the Fed have at guiding opinion on the November 1st meeting as the blackout period starts on Saturday 21st October. They have somewhat backed themselves into a corner as their data dependent stance now demands they hike following the NFP blowout and strong beats on CPI and PPI. The odds of a 25bps fraise have climbed ever higher and ended Friday at 93.8%. However, they seem to be desperately signalling they won’t hike. Dallas Fed President Lorie Logan first mentioned “less need for additional monetary policy tightening” on Monday as she opined rising term premiums would do the work for the Fed. This message was echoed two days later by Waller, who said, “Financial markets are tightening and will do some of the work for us…Fed can watch and see what happens on rates.” Philly Fed President Harker finally said on Friday “I believe that we are at the point where we can hold rates where they are.”
Fed Chair Powell is due to talk next Thursday so if the Fed’s message really is that they will pause again, he may have to say so explicitly as the market hasn’t listened so far.
Data is on the lighter side next week with retail sales on Tuesday potentially important, especially as it follows the consumer confidence miss on Friday. A weak reading could weigh on equities.
Probable Moves Next Week(s)
Bigger picture, constructive action on the higher timeframe charts suggests 4216 could mark the bottom and lead to new highs above 4607. I will therefore look for higher lows to hold next week.
Friday’s drop somewhat spoiled the bull party, but there was some understandable unease about holding over the weekend given the Israeli ground offensive. Assuming nothing terrible (in market terms) happens, the S&P500 could hold up and even rally on Monday.
A move above 4385 may initially fade, but would be a good signal that a move to 4505 is underway, especially if the channel is breached.
4283 is the first good level of support, with 4216 now a huge make or break level for the next few months.
If 4216 were now to be broken, it could still lead to a strong bounce from the 4151 area back to 4325-35, even 4500. However, it would have serious long-term implications and any recovery rally should make lower highs with 4607 to set up at least another proportional drop. This would target a minimum of 4049 (the 50% retrace of the 2022-2023 rally), and potentially below 3491.
Read the full article here

