Investment Thesis
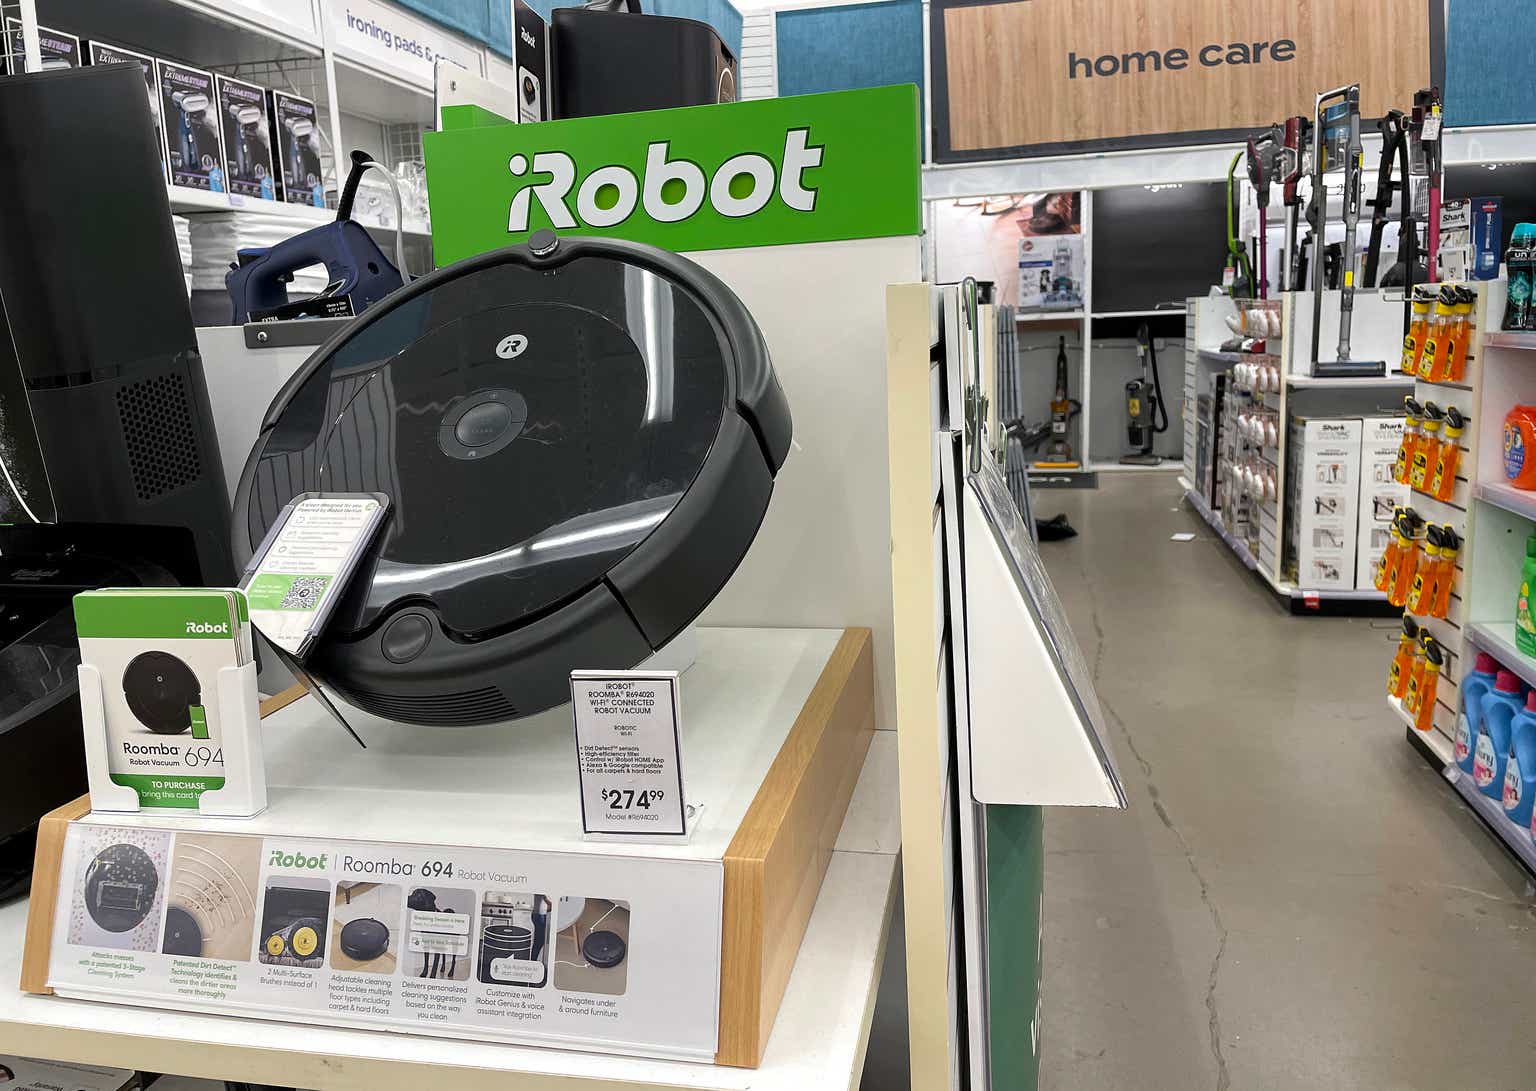
iRobot Corporation (NASDAQ:IRBT), known for its Roomba vacuum cleaners, finds itself at a financial crossroads. iRobot Corporation, despite its 30-year history and a customer base that grew by 18% to 18.6 million in Q2 2023, is currently a high-risk investment, making it unsuitable for both short-term and long-term portfolios. The company’s revenue took a significant hit, declining by 27.5% to $396.9 million in the first half of 2023 from $547.3 million in the same period last year. This decline is coupled with a deteriorating Non-GAAP Operating Margin, which plummeted from -13.1% to -28.4%, signaling weakened operational efficiency. On the balance sheet, the current ratio worsened from 1.78 to 1.35, and the debt-to-equity ratio increased from 0.75 to 0.94, raising liquidity and solvency concerns. External factors, such as a 25% tariff on Roomba products effective October 2023, add another layer of financial strain. The pending acquisition by Amazon at a reduced share price of $51.75 from $61 further introduces uncertainty, making it difficult to forecast the company’s market position accurately. Given these metrics and external variables, the substantiated recommendation is a decisive “Sell”.
Overview
Founded in 1990, iRobot has built a reputation in the consumer robotics market by selling 50 million consumer robots like its popular Roomba vacuum cleaners. However, the company has a few concerns; the first half of 2023 saw a revenue decline to $396.9 million, a steep 27.5% drop from $547.3 million during the same period the previous year. This decline is segmented into an $89.6 million (or 30.6%) drop in domestic revenue and a $60.9 million (or 23.9%) decrease in international revenue, signaling widespread market challenges.
To counter the falling revenues, iRobot implemented two rounds of workforce reductions, amounting to layoffs of 8% and 7% of its total employees. These cuts resulted in a net reduction of approximately 233 employees since the end of fiscal 2021 and are projected to save the company around $42 million in 2023. In line with its cost-cutting initiatives, the company also reduced its inventory levels to $170.6 million, marking a substantial $114.7 million reduction from the end of fiscal 2022.
Adding to the financial complexity, a 25% tariff will be applied to Roomba products imported from China into the U.S., starting October 1, 2023, which could further stress the company’s revenue streams.
On the investment dimension, iRobot’s long-standing expertise in AI and robotics could make it an appealing long-term investment, especially as the market for smart homes continues to grow.
An additional factor to consider is Amazon’s ongoing acquisition of iRobot, where the share price in the merger agreement was recently revised downwards from $61 to $51.75. While this acquisition could potentially leverage Amazon’s extensive market reach to revitalize iRobot, it also introduces a layer of uncertainty regarding the company’s valuation and future direction.
Despite these challenges, iRobot has seen an 18% growth in its digital customer base to 18.6 million compared to Q2 2022, suggesting some level of market traction. Yet, the company’s downward-revised merger value from $61 per share to $51.75 and the more significant decline in domestic revenue compared to international revenue raise questions about its long-term sustainability and market positioning.
In summary, while iRobot has a strong historical presence in the consumer robotics market and has demonstrated some resilience through its cost-cutting measures, the steep decline in revenue, regulatory challenges, and uncertainties surrounding its acquisition by Amazon make it a high-risk investment at this time.
Revenue Analysis
Author analysis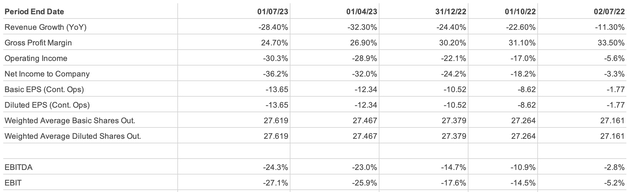
The financial data for the company is bad across multiple fronts, backed by declining numbers. For the six months ending July 1, 2023, the total revenue plunged by 27.5% to $396.9 million from $547.3 million in the same period in 2022. This decline is a red flag, usually indicative of issues within the core business. The Non-GAAP Gross Profit almost halved to $92.8 million from last year’s $183.5 million. This drastic decrease is further underlined by a 10.1% reduction in Non-GAAP Gross Margin, which slipped from 33.5% to 23.4%. This indicates that the company has been far less profitable and has failed to cut production costs proportionately to declining sales.
The company’s Non-GAAP Operating Loss also worsened by 57%, going from $71.8 million to $112.7 million year-over-year. The operating margin declined, sinking from -13.1% to -28.4%, pointing towards deteriorating operational efficiency. When it comes to unit shipments, there was a 31% decline in the number of robot units sold—down to 1,266,000 from 1,839,000. Although there was a modest increase in the average selling price per unit, rising from $332 to $366, this clearly hasn’t been enough to offset other negative factors.
On the cost side, the total cost of revenue fell from $358.9 million to $306.8 million, and operating expenses also went down from $275.7 million to $242.4 million. However, these reductions haven’t been substantial enough to maintain profitability, indicated by a net loss that more than doubled to $161.9 million, compared to $73.8 million in the prior year. Even the tax situation has deteriorated, with the company incurring a tax expense of $4.5 million as opposed to a tax benefit of $32.3 million last year. The total comprehensive loss expanded from $56.7 million to $165 million.
Forecasting based on these figures suggests a gloomy five-year outlook for the company unless there are significant operational and strategic turnarounds. The declining trends in revenue, profit, and operational efficiency might force the company into unsustainable financial practices, like digging into reserves or accumulating debt. The quality of earnings clearly shows that the company is not only incurring losses, but those losses are escalating at an alarming rate, casting serious doubts on the long-term sustainability of the business. The key metric to keep an eye on would be the Non-GAAP Operating Margin; its drop to -28.4% from -13.1% raises questions about the company’s long-term viability.
In summary, the company is navigating rough financial waters, with nearly every metric moving in a concerning direction. In light of the falling revenue, increasing losses, and deteriorating margins, the safest investment recommendation would be to “Sell.”
Balance Sheet Analysis
Starting with its assets, the company experienced a significant drop in cash and cash equivalents, declining by almost 51% from $117,949k to $57,954k, possibly indicating operational challenges. Accounts receivable increased from $66,025k to $72,306k, which could be a positive sign but might also imply collection difficulties. The inventory level fell considerably from $285,250k to $170,561k, suggesting a decline in sales. Other current assets also saw a drop from $59,076k to $47,424k. Summing these up, total current assets dwindled from $528,300k to $348,245k.
Turning to long-term assets, there was a decline in property and equipment from $60,909k to $49,894k. Operating lease right-of-use assets and deferred tax assets also decreased to $21,720k and $12,972k, respectively. However, goodwill increased marginally from $167,724k to $170,873k. Intangible assets and other assets decreased to $10,421k and $20,014k, respectively. As a result, the total assets of the company witnessed a decline from $835,443k to $634,139k, representing a sharp 24% decrease, clearly indicating that the company is contracting its asset base.
On the liabilities side, accounts payable decreased from $184,016k to $138,803k, and accrued expenses increased to $105,707k. Deferred revenue and customer advances slightly reduced to $12,172k, bringing total current liabilities to $256,682k, down from $296,183k. Long-term liabilities like operating lease liabilities, deferred tax liabilities, and other long-term liabilities also showed a downward trend, resulting in total long-term liabilities of $52,038k, down from $63,544k.While total liabilities also shrank from $359,727k to $308,720k, the 14% drop isn’t as steep as the decline in assets, raising potential concerns about the company’s financial structure.
When it comes to equity, an 81% plunge in retained earnings from $199,415k to $37,503k poses serious questions about the company’s profitability. Furthermore, the company’s liquidity and financial risk have worsened, as indicated by the Current Ratio moving from 1.78 to 1.35 and the Debt to Equity Ratio rising from 0.75 to 0.94. This signals a heightened financial risk and shows that the company is now more reliant on debt to finance its operations. To sum up, the sharp decline in retained earnings and cash and the decrease in assets relative to liabilities raises questions about the sustainability and quality of the company’s earnings.
Based on these trends, one can project that if nothing changes, the company’s retained earnings might go negative in less than a year, and its total assets may continue to decline, aggravating solvency issues.
The only positive is a slight increase in goodwill from $167,724k to $170,873k, but even this is overshadowed by the slide in retained earnings. Retained Earnings become the most critical metric to closely monitor given its significant decline and importance in evaluating the company’s future sustainability and profitability.
In summary, iRobot Corporation is navigating through turbulent financial waters. The significant depletion of cash reserves, a sharp decline in total assets and retained earnings, and adverse changes in key financial ratios like Current Ratio and Debt to Equity Ratio make it clear that immediate action is required to stabilize the company’s financial health.
In light of these findings, my investment guidance leans towards a “sell” recommendation for iRobot Corporation. My analysis suggests the company is a high-risk investment at this point.
Free Cash Flow Analysis
Author analysis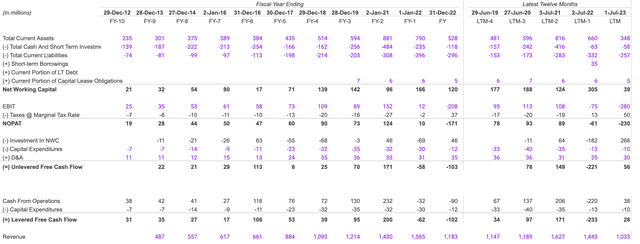
In the fiscal year 2021, the cash from operations was $206 million but declined to a negative $220 million in 2022, followed by an increase to $38 million in 2023. This volatility, from a surge in 2021 to a dip in 2022, followed by a mild resurgence in 2023, shows turbulence in the company’s operations.
In 2021, the Net Working Capital (NWC) stood at $124 million, and it experienced a substantial rise to $305 million in 2022, marking an impressive 145% growth. However, by 2023, it dropped by 87% to $39 million. This significant decline indicates diminished liquidity.
Shifting the focus to investing activities, the capex spend of $35 million in 2021 declined to $13 million in 2022 and further to $10 million in 2023. This diminishing CapEx over this period can be interpreted as the company’s cautious stance on capital-intensive investments. While this might be a tactical move to bolster short-term liquidity, it raises concerns about the long-haul growth trajectory, considering the company’s reluctance to strengthen its asset base.
When we look at the Earnings Before Interest and Taxes (EBIT), there’s a noticeable trend of decline. Starting with a positive 108 million in 2021, it plummeted to a negative 75 million in 2022 and further deteriorated to negative 280 million in 2023. This consistent downturn in EBIT is disturbing.
Navigating to the quality of earnings, the Net Operating Profit After Tax (NOPAT) recorded a promising $89 million in 2021. Yet, the subsequent years painted a grimmer picture: a dip to -$61 million in 2022 and a steeper descent to -$230 million by 2023. In addition, revenue declined from 1,627 million in 2021 to 1,443 million in 2022, which is an 11% decrease, and then contracted even more to 1,033 million in 2023, marking a 28% decrease from the previous year. Such a consistent drop in revenue could be attributed to factors like a slump in sales, pricing challenges, or increasing competition in the market.
Projecting into the future, if the current trajectory of descending revenue, EBIT, and NOPAT holds, 2024 might witness revenue dropping below the $1,000 million threshold, and the negative trend in EBIT and NOPAT could remain unless significant corrective measures are implemented.
Unlevered Free Cash Flow (UFCF) declined from $149 million in 2021 to -$221 million in 2022, although 2023 observed a slight rebound to $56 million. The 2022 decline in UFCF is a red flag, pointing towards operational bottlenecks and external headwinds.
Management’s efficiency seems questionable, considering the falling NOPAT and revenue. Major risks for the company include declining revenue, negative operational profitability, and potential liquidity challenges. Externally, a spike in interest rates could tighten the financial noose, and broader economic downturns might aggravate the decline in revenue.
To summarize, the sharp decline in NOPAT and UFCF during 2022 and the declining CapEx outlays over the years are the red flags. On the positive side, the resurgence in 2023’s operational cash flow and UFCF offers hope, signaling adept resource allocation.
When it comes to investing, it seems prudent to adopt a wait-and-see approach, holding off until there’s more clarity on how the company plans to address these challenges.
Cash Conversion Cycle
Author analysis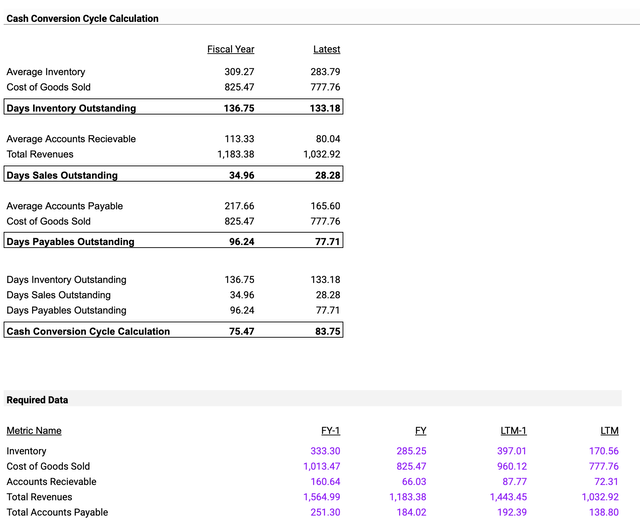
The company’s average inventory decreased from $309.27 million in the fiscal year to $283.79 million in the latest period, marking an 8.2% reduction. This decline might be an indication of a possibly lower production. The Cost of Goods Sold (COGS) also declined from $825.47 million to $777.76 million, translating to a 5.8% decline. This drop could be a result of fewer goods being sold. Furthermore, the total revenues took a hit, declining by 12.7% from $1,183.38 million to $1,032.92 million. This significant decrease could raise concerns about reduced sales.
As for performance indicators, there are a few red flags. The Days Inventory Outstanding saw a marginal decrease from 136.75 to 133.18 days. The Days Sales Outstanding took a positive turn, decreasing by 19.1% from 34.96 days to 28.28 days, which implies a faster collection of its receivables. However, the Days Payables Outstanding (DPO) also decreased from 96.24 days to 77.71 days, a 19.3% decline. This trend suggests the company is clearing its supplier payments more swiftly. The Cash conversion cycle (CCC) increased from 75.47 days to 83.75 days, pointing towards potential liquidity challenges ahead.
If the current data trends persist without any external disruptions, there could be further reductions in revenues and COGS. Inventory management appears to be consistent, but the increase in the CCC could signify impending liquidity challenges.
When assessing the company’s value, its ability to efficiently manage its working capital, as indicated by the simultaneous reduction in Days sales outstanding and DPO, stands out. However, the decrease in revenue, combined with the increasing CCC, does cast doubts on the sustainability of this trend. The CCC’s rising trend is a key metric to monitor closely, as it might be an early warning sign of upcoming liquidity challenges.
In sum, the financial data presents a mix of positive signs, such as effective working capital management. However, challenges like dwindling revenues and a rising cash conversion cycle advocate for a cautious approach when considering investments in this company.
Sloan Ratio
Author analysis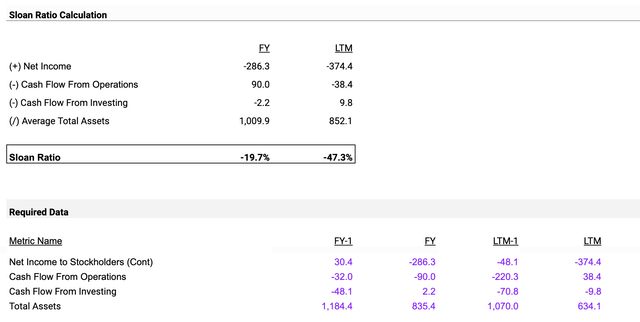
The net loss stood at $-286.3 million during the fiscal year and widened to $-374.4 million in LTM, reflecting a 30.8% increase in losses. Furthermore, the company’s cash flow from operations declined from $90 million in the fiscal year to a negative -$38.4 million in LTM. This underscores potential issues in the company’s ability to generate operational cash. On the investing front, cash flow from investing (CFI) increased from -$2.2 million in the fiscal year to $9.8 million in LTM. This increase indicates that the company is liquidating more of its investments or simply pulling back on new investment ventures. Additionally, there has been a 15.6% reduction in average total assets, dropping from 1,009.9 in the fiscal year to 852.1 in LTM.
Projecting into the next year, if we see these current patterns persisting, the company’s net income could further decline. The operational cash-generating ability may stay negative or potentially deteriorate even more. Also, without any fresh capital influx or if there’s an ongoing liquidation trend, the average total assets could shrink further.
In summing up, the available data paints a picture of potential financial turbulence. The ongoing negative net income trend, coupled with a decline in operating cash flows and a negative Sloan Ratio, all signal a need for investors to be cautious.
Shareholder Yield
Author analysis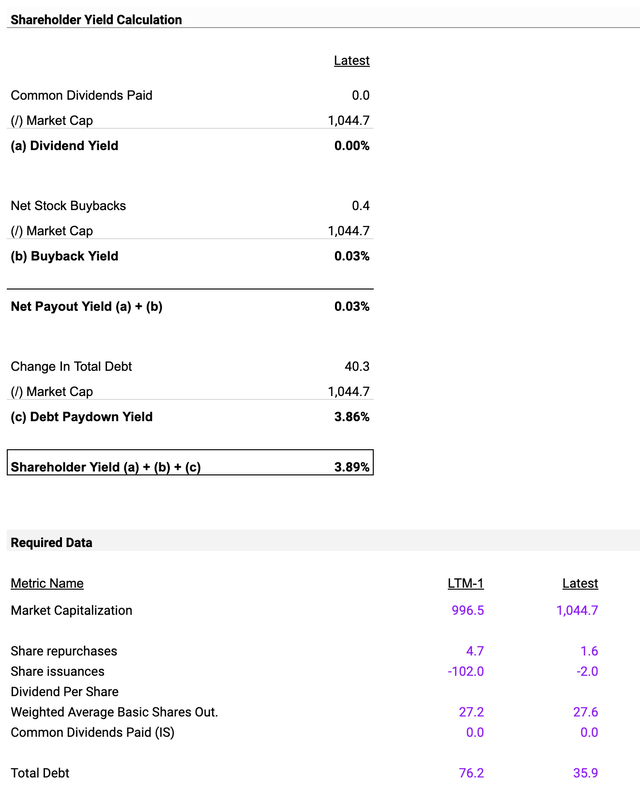
With a dividend yield of 0.00%, the company has allocated zero funds for dividend distribution, despite a market capitalization of $1,044.7 million. This zero allocation for dividends implies a strategy of retaining all earnings, potentially to service its debt of $40.3 million. On the share buyback side, a limited investment of $0.4 million was made, resulting in a low buyback yield of 0.03% against a market capitalization of $1,044.7 million. This 0.03% buyback yield reveals a decision to repurchase its shares, possibly as a liquidity preservation measure.
In debt management, the company has increased its total debt by $40.3 million, yielding a negative debt paydown yield of -3.86% when measured against its market capitalization of $1,044.7 million. This negative yield indicates a clear strategy of borrowing rather than debt reduction, possibly to finance operational costs or strategic initiatives. The total shareholder yield, a calculated metric that combines the dividend yield, buyback yield, and debt paydown yield, precisely stands at 3.89%.
If the company maintains its current zero-dividend and 0.03% buyback yield policies, shareholders can statistically expect a continuation of low returns, specifically in the form of dividends and buybacks.
In summary, each metric—0.00% dividend yield, 0.03% buyback yield, and -3.86% debt paydown yield—collectively substantiates that the company is currently more focused on internal financial management and liquidity preservation than on delivering returns to shareholders.
Investment Recommendation
Based on my analysis of iRobot Corporation’s financial situation, my investment recommendation is a definitive “Sell”.
Here’s why: Revenue has dropped significantly by 27.5% to $396.9 million, and Non-GAAP Gross Profit has nearly halved to $92.8 million. The company’s Gross Margin has also declined from 33.5% to 23.4%, indicating it’s making less money per sale.
The risk level of investing in this company is high, with low prospects for reward. The declining unit sales could indicate that iRobot is losing its market share.
In terms of its balance sheet, the company’s assets, including cash, are rapidly declining, while liabilities are not decreasing at the same rate. Retained earnings have plummeted by 81%, which is extremely troubling. This all indicates low liquidity and potential difficulty in covering short-term obligations.
Additionally, key performance metrics like NOPAT and EBIT are both negative and getting worse. The Sloan Ratio also points to a deterioration in the quality of earnings.
In summary, almost every financial indicator suggests that iRobot Corporation is in a poor state. With negative data across revenue, profit margins, balance sheet, and cash flows, this is a high-risk scenario without a favorable reward outlook. Therefore, the prudent action would be to sell any holdings in iRobot Corporation.
Read the full article here

