
I have been growing increasingly skittish on owning smaller companies in my personal portfolio, and have written fewer articles on such stocks as 2023 has progressed. I made a Sell call on the iShares Russell 2000 ETF (NYSEARCA:IWM) in March here. The problem is smaller names traditionally are quite weak relative to blue chips going into a recession. They are often less profitable businesses as a group, usually minor players in their industry. Well, this sector of Wall Street has continued to perform poorly, especially when measured against the leading Big Tech names. I am reiterating my Sell rating, as recession appears to be the most likely macroeconomic outcome on the major spike in long-term interest rates since early summer.
The opposite of a bull market, the primary small-capitalization company Russell index of 2000 stocks (generally companies with equity market caps of a few billion or less are included, with a diversified cross-section of industries representative of the U.S. economy held) just reached a new 52-week “closing” low on Friday (October 20th, 2023). I have been explaining the worrisome development of a handful of Big Tech names being responsible for the entire market advance in the U.S. using cap-weighted designs. However, the vast majority of individual company names in America are now flat to lower on a trailing 12-month period.
Statistically speaking, truly weak breadth participation over a period of years has been one of the most successful indicators of both a topping market (approaching bear drop) and a recession in GDP output.
You may not want to hear this… but 1986-90, 1998-2001, 2006-08, 2017-20, (alongside an expanded list of consequential tops in Wall Street history over the last century), and now again since 2021 – all experienced weak breadth participation as an early warning to investors. Of even greater concern, the 2023 market between March and October has just witnessed one of the WORST periods ever for participation during a presumed bull market run (according to the more widely-watched Standard & Poor’s blue-chip index creation).
In fact, a weak Russell 2000 (RTY) combined with an inverted Treasury yield curve and rising crude oil prices like October 2023’s situation has 100% of the time led to a recession since the early 1980s. Let me explain with some examples.
Historical References
When we review the history of past bear markets and recessions, material underperformance of the S&P 500 (SP500) by the small-cap Russell indexes over a period of years has been the rule. Specifically, when we compare past trends of lagging gains in the Russell 2000, investors should be quite nervous about Wall Street’s immediate prospects.
Below I am drawing the periods leading into each of the last four recessions. I am not charting the full bear market and recession results, as each played out a little differently. My argument today is investors should be preparing for both a drop in equities and a recession soon.
1990 Recession
In terms of oversized stock market crashes, both 1929 and 1987 experienced very narrow participation months in advance. Below you can review the sharp underperformance of the main Russell index of small caps vs. the S&P 500 starting in the middle of 1986 into the October 1987 price crash of -40% over 7 weeks in the S&P 500.
We didn’t get a recession during 1988 as a result of stock market turmoil, but the continuation of lagging price gains in the Russell 2000 did warn of an eventual recession. A spike in crude oil during the first Persian Gulf War in the summer of 1990, following the 1989 to early 1990 Treasury yield curve inversion proved too much of a hit to consumer confidence/wealth and banking system health.
YCharts – Russell 2000 vs. S&P 500, Price Changes, 1986 into 1990 Recession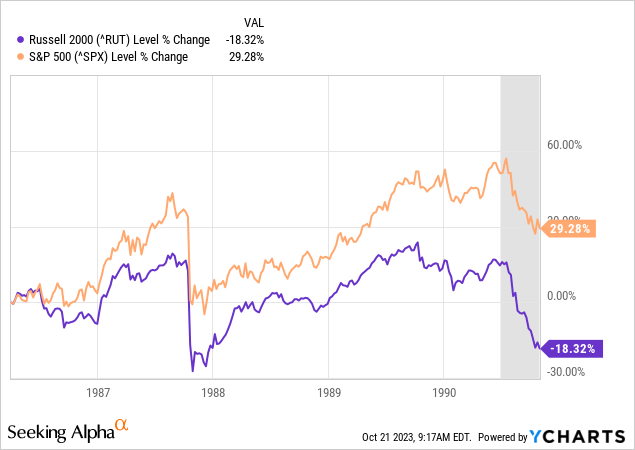
2001 Recession
The multi-year boom in Dotcom tech stocks ended between 1999-2000. To a degree, the Russell 2000 predicted the end was near, as it vastly underperformed during 1998 and 1999. An inverted Treasury yield curve and jump in crude oil appeared in late 1999 and early 2000. The actual drop in economic activity started in 2001. The tech-heavy NASDAQ 100 (NDX) would eventually fall better than -80% between 2000-02 (not pictured), while the S&P 500 fell almost -50% from top to bottom.
YCharts – Russell 2000 vs. S&P 500, Price Changes, 1998 into 2001 Recession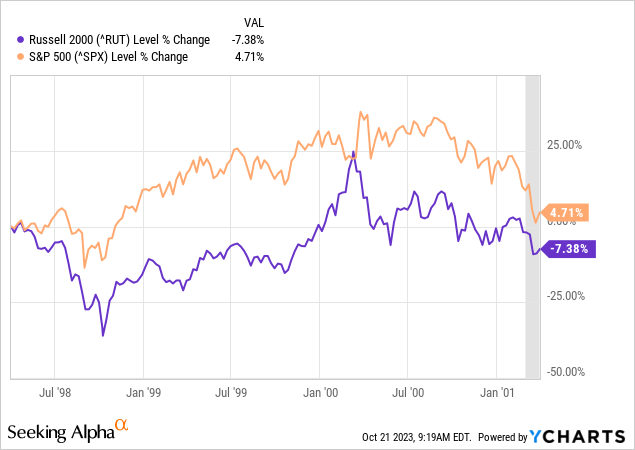
2008 Recession
Again, beginning in early 2006, the Russell 2000 stocks began to lag the S&P 500. An inverted Treasury yield curve and a big spike in crude oil were the 2007 story. What transpired after this chart was the Great Recession bust in real estate and banking, with a -50% price haircut in the typical Wall Street stock into March 2009.
YCharts – Russell 2000 vs. S&P 500, Price Changes, 2006 into 2008 Recession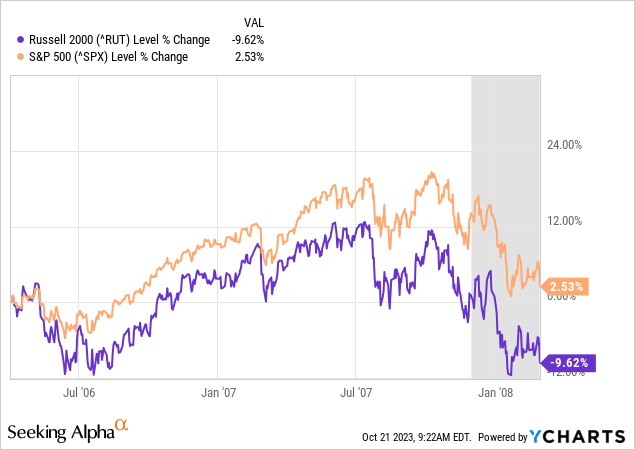
2020 Recession
Believe it or not, the U.S. stock market was getting ready for trouble ahead, well before the 2020 pandemic was a thing. The Russell 2000 index severely underperformed starting in August 2018. A minor but still relevant Treasury yield curve inversion appeared in 2019. Crude oil prices were steady, but not rising going into 2020.
Of course, the economic closures of early 2020 sent all stocks into a tailspin from fear and liquidity issues. A deep recession was blunted by record Fed money printing efforts (such as unlimited QE bond buying) plus a rush of government stimulus spending (and borrowing). The Russell 2000 stocks effectively crashed -40% top to bottom, with the S&P 500 down a little less.
YCharts – Russell 2000 vs. S&P 500, Price Changes, 2017 into 2020 Recession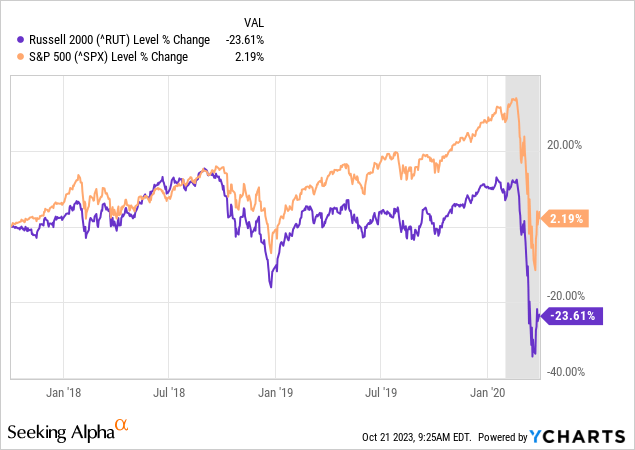
Present Underperformance
Today’s setup is really no better than the other pre-recession periods. We have just experienced a massive rise in interest rates since 2021, the Treasury yield curve a few months ago was at its worst spread inversion since the early 1980s, and crude oil moved from US$20 a barrel at pandemic lows to $120 in early 2022. The current $90 price has jumped from $70 during the summer, and Middle East violence (just like 1990) could erupt into all kinds of chaos for the oil market and consumer/business confidence in the weeks to come.
I have been amazed at the number of -1% down days for the Russell 2000 index vs. UP days in the Big-Tech concentrated NASDAQ 100 since March. The difference in trading vs. S&P 500 changes is basically unsustainable. Either small-cap stocks are at a point where they outperform on the upside vs. Big Tech names, or our market leaders reverse into sizable downtrends to catch up to the rest of market reality (discounting a recession).
For sure, from my vantage trading U.S. stocks for 37 years, now is the time to be quite anxious about fully-invested long positions in equities. Although history does not repeat in an exact fashion, it’s easy to see numerous parallels to 1990, 2001, 2008, and 2020 trading actions. Holding onto “soft landing” hopes for the economy and excited bullishness regarding stock investments is not a logical conclusion presently.
YCharts – Russell 2000 vs. S&P 500, Price Changes, March 2021 to Present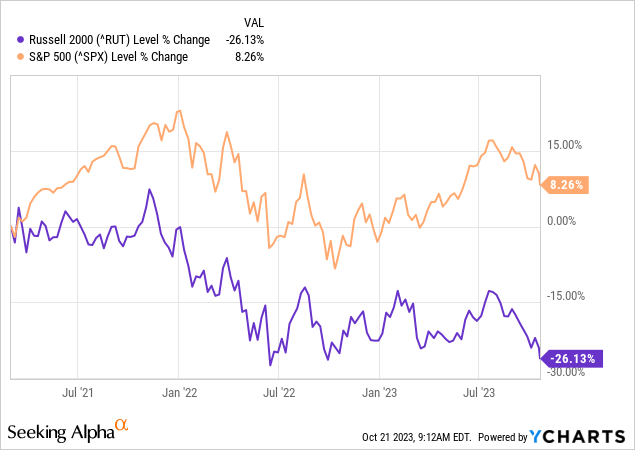
Final Thoughts
Again, the main trading vehicle based on this smaller-cap index idea is the iShares Russell 2000 ETF, with a 0.19% management fee annually. I would be very leery about buying or owning IWM until a recession hits and the Federal Reserve begins lowering interest rates. I still rate IWM a Sell on a 12-month forward look.
StockCharts.com – IWM, 12 Months of Daily Price & Volume Changes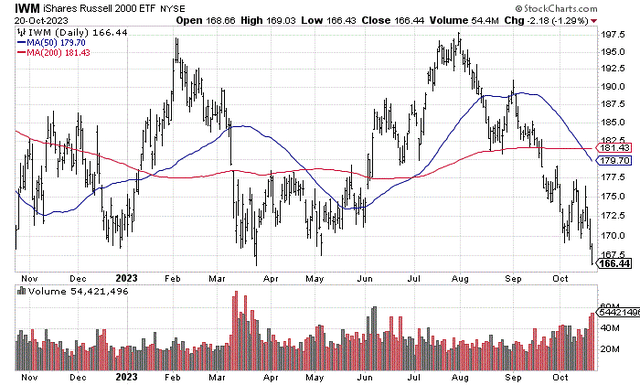
2023’s wicked underperformance of the Big-Tech heavy S&P 500 or NASDAQ 100, with a still inverted Treasury yield curve and now rising crude oil prices (inflating business costs and degrading consumer income/spending), all point to a difficult equity investment environment in the months ahead.
We could see a sharp decline in IWM over the next 3-6 months (-20% to -30%), with a sizable rebound by next fall back to unchanged levels. Nevertheless, with Wall Street still overvalued long term, using the Shiller P/E Ratio or total equity market worth vs. GDP output, it’s entirely possible IWM will sell off and not immediately recover. Past prolonged bear market periods like 2000-02 and 2007-09 lasted a number of years. It will really depend on the size, severity, and length of recession that is now all but assured from the largest multi-year rise in interest rates since the 1970s.
Lower corporate income levels for 2024 and a recession are looking more likely by the day. The new 52-week low in the Russell 2000 should encourage reasonable traders and investors to prepare their portfolios for a rough stretch.
Thanks for reading. Please consider this article a first step in your due diligence process. Consulting with a registered and experienced investment advisor is recommended before making any trade.
Read the full article here

