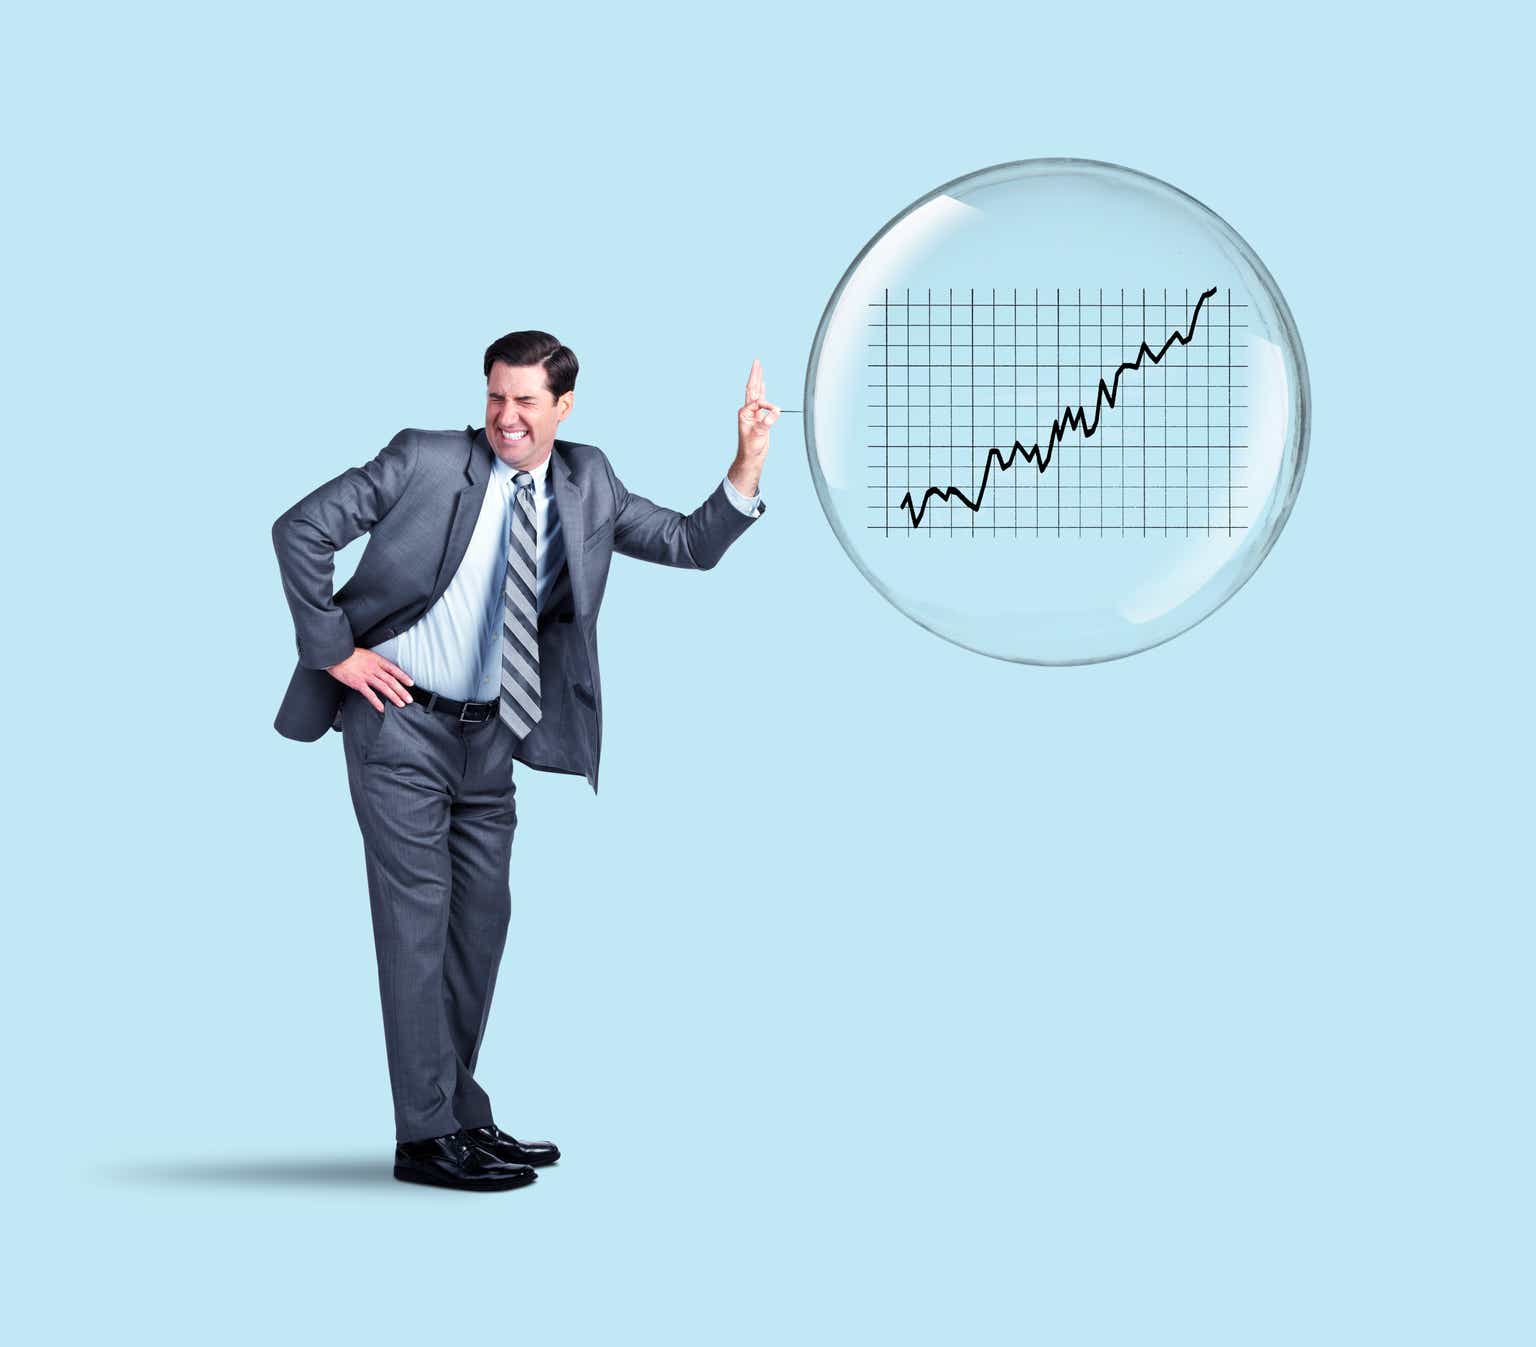
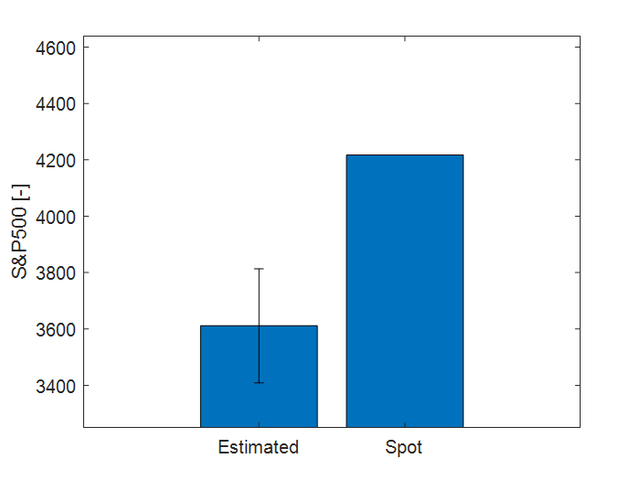
The market and the economy don’t always sync up. Stocks can surge even during a bubble, but when it bursts, investors feel the pain. The equity market is currently overvalued by about 17% according to my proprietary S&P500 valuation model described in here; see Figure 1.
Generated by the author.
Figure 1: Estimated fair value of the S&P500 and spot value.
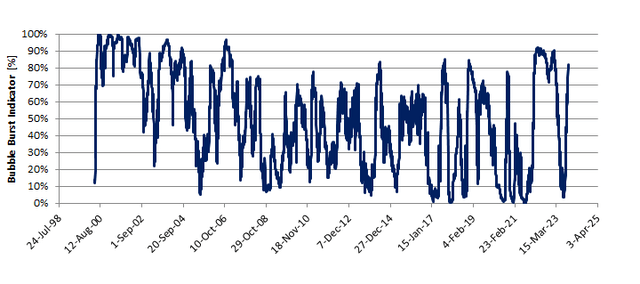
I have developed an indicator, the Bubble Burst Indicator, that provide a signal when the equity market Bubble is about to burst; see Figure 2. Values above 75 to 80% indicate that the downward movement of the equity market is about to start. The 80% threshold was passed on October the 16th. Since then the S&P500 returned: -3.58%. The readings are moving higher and we are now around 83-84%. If we stay at this level or above, I estimate a de ja vu of 2022 with the S&P500 that could re-test its fair valuation of about 3,600 with a smooth sell-off. If a panic starts, we might experience lower levels. I have a negative outlook for the equity market. As I put my actions were my words are, I have opened several positions to take advantage of the situation. Positions that will stay open till the Bubble Burst Indicator readings will be below the threshold value.
Generated by the author.
Figure 2: Bubble Burst Indicator readings.
Up to now, I believe it is clear, where do I stand and why and my recommendations when it comes to investing in equities (do not do it now). In the second part of this article, I’ll describe how I have created the Bubble Burst Indicator and its building blocks. Spoiler alert, I’ll not share the secret sauce but I’ll provide enough information to re-verse engineering it. I’ll also show a backtest on the potential of using such indicator when equity bubbles are bursting.
I agree with Ray Dalio: Pain + Reflection = Progress
The Pain
2022 was a very painful year in my investment career, nearly nothing seemed to work. I used to rely a lot in rotating positions in between asset classes that were typically uncorrelated but… not 2022. Nearly everything was correlated and moving south. I take investment decisions based on different volatility parameters like the VIX roll yield and VIX measured at different time frames but… 2022 was special: nothing flashing red while the equity market slowly and painfully moving down.
The Reflection
In the middle of the year, I asked myself:
- Why the volatility parameters I usually look at did not work this time?
- Was there anything else that I could have looked at that would have spared me from this painful drawdown?
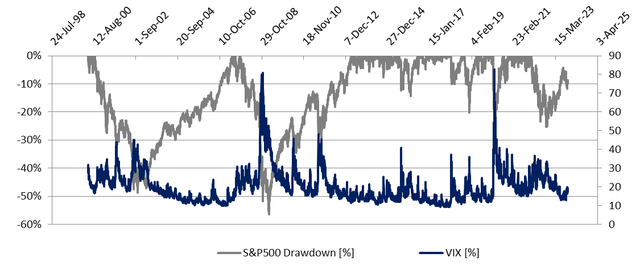
It took me a few months, lot of Excel and a tip from a market veteran to get into a Eureka moment. This friend of mine said: 2022 reminded him of the Dotcom bubble. At that time the market was trending down but, at a certain extent, there was neither panic nor noise, just a painful bleeding. He was right. If we assume that panic and noise translate into VIX spikes, in Figure 3, it can be observed that despite a 20-30% drawdown, the VIX was elevated but never shoot significantly higher than 30% during the Dotcom bubble. This was very different from what many of us have experienced after the 2007-2009 financial crisis. We got into the mental picture of: there is a lot of drawdown thus the VIX will have to spike. As 2022 showed, this was far from the truth.
Generated by the author.
Figure 3: S&P500 drawdown and VIX.
In essence VIX is a standard deviation. A value of 15% means that within one year from now, the S&P500 could close plus/minus 15% within 68% probability. First keyword is “plus/minus”. We should disconnect the belief that the S&P500 movement is inversely correlated to the one of the VIX. This is correct 85% of the time, meaning that there are 15% of instances in which the two are positively correlated or uncorrelated. From Figure 3, we can make a second observation: the VIX spikes only during uncertainties. An example quite fresh to our memory is March 2020. There are other case like 2018 Q4 and August 2015. This gives an answer to the first question, we should stop assuming a nearly perfect inverse correlation between the VIX and the S&P500.
Could this situation have been spotted?
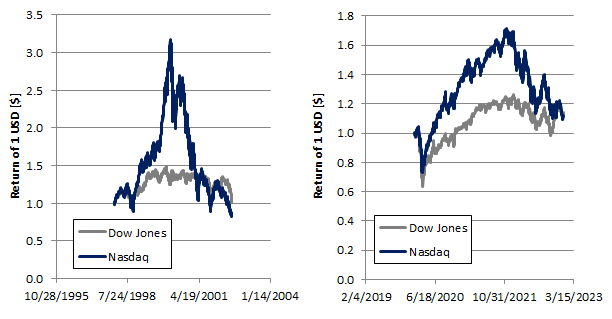
I have tried not to overcomplicate my life and I made the hypothesis that somehow this information was hidden in the prices of the main US indexes. What 2000 and 2022 had in common? In both instances, everyone was talking about stock market bubble. Usually overinflated prices are found in growth stocks (typically part of the Nasdaq 100, QQQ) and less in value stocks (typically part of the Dow Jones, DIA). This can be observed in Figure 4, there was a major divergence between the growth of the Nasdaq and Dow in 2000 and 2022.
Generated by the author.
Figure 4: Price evolution of the Dow Jones and Nasdaq 100 during the Dotcom bubble and 2022.
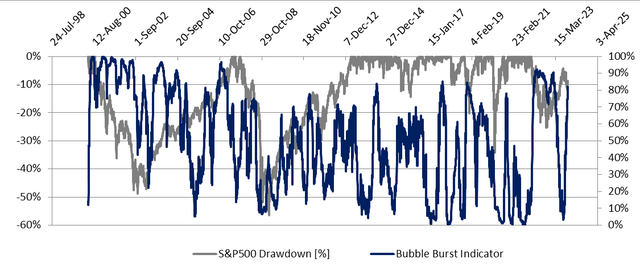
But the market is not the economy, even if a bubble exists we do not know when it is going to burst, maybe until now. I will not share the details of my secret sauce, I leave the homework to the reader, but by looking at the price action of the Nasdaq and the Dow Jones, it is possible to derive an indicator that spots when a bubble might burst. In Figure 5, this “bubble burst” indicator showed high readings during 2000, 2022 and early 2023.
Generated by the author.
Figure 5: S&P500 drawdown and bubble burst indicator.
The Progress
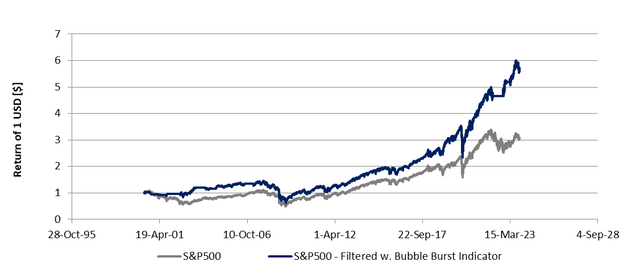
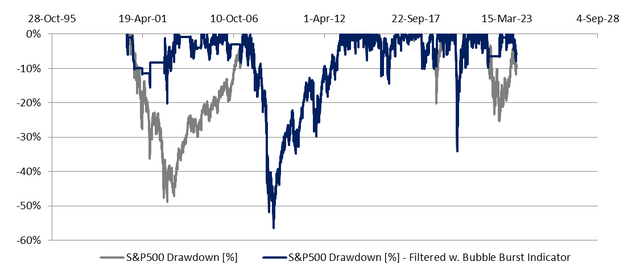
The simplest way to use it is to identify a threshold level beyond which a strategy moves from 100% equities (S&P500 in this example, SPY) to cash. I found the sweet spot being 75-80%. Higher reading indicates pain for the equity market. A simple backtest is shown in Figure 6; a threshold value of 80% was used. The lower chart shows a drawdown that is drastically reduced. The reduction in drawdown resulted in 85% higher return (upper chart) just with the use of one single indicator.
Generated by the author.
Generated by the author.
Figure 6: Return (upper) and drawdown (lower) of the S&P500 buying and holding vs. going to cash above the threshold value of the bubble burst indicator.
By feeling the pain of 2022 and reflecting on it, I have managed to create an indicator that should spot when an equity market bubble is about to burst. The indicator is not flashing red. Place your bet, I have placed mine.
Read the full article here

