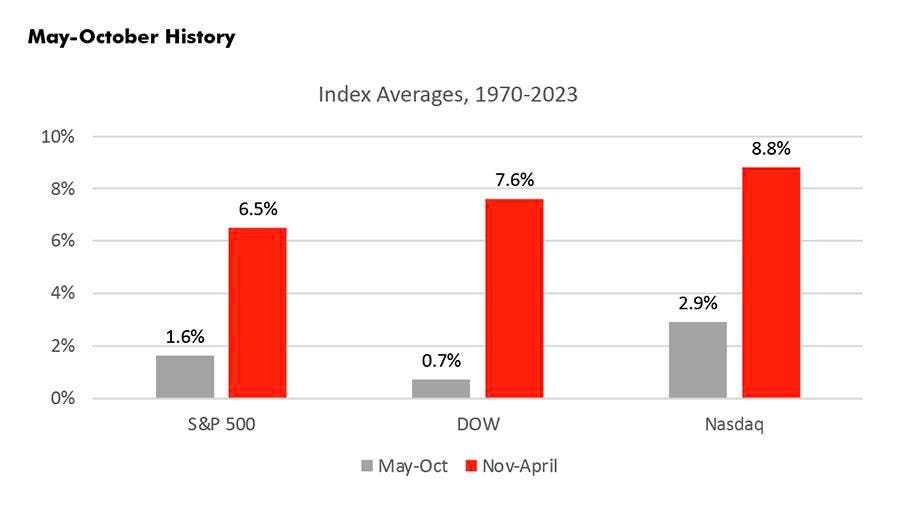
There is an old stock market adage that states that every year one should “sell in May and go away”, not reinvesting in equities until November. This saying is based on the generally held principle that stocks rise more in the 6-month period from November to April than from May to October. The fact that significant market declines have occurred in late summer or early fall – like the 1987 market crash – has helped to reinforce this belief.
Upon examining the actual data, over the last 50 plus years, stocks do indeed perform better in the November-April semester than in May-October. This is seen on the bar chart below, which demonstrates that in the last 52 years, the S&P 500 has averaged a 6.5% gain during November-April versus only a 1.6% gain the rest of the year, a difference of 4.9%. The NASDAQ
NDAQ
This performance differential between the two time periods is exacerbated historically in the third year of the US presidential cycle, about which we wrote earlier this year. As shown below, in those years, the differentials are even greater with the S&P 500 having a 12.8% spread, the DJIA having a 13.6% spread, and the NASDAQ having a 14% spread.
Looking more granularly within these periods, November tends to be the strongest month when all years are considered. When the focus is just on the third year of the presidential cycle, January tends to be the strongest. So far in 2023, this has definitely played out with the NASDAQ rising an impressive 10% this January, the S&P 500 gaining over 6%, and the DJIA almost 3%.
Meanwhile, the weakest month overall and for the third year of the presidential cycle historically is September, with negative returns across the board. May and June are actually solidly positive both overall and in the third year. Again, although returns are positive during this period, except for the NASDAQ, they are extremely muted.
S&P 500 Each Third Year of Presidency since 1970
Digging deeper into the presidential cycle, the May-October period has underperformed the November-April period in 11 of 13 instances or 84% of the time. Interestingly, S&P 500 has started the May-October period above its 200-DMA in every instance.
This amazing fact speaks to the strength of the first half of the third year of the presidential cycle, which is by far the best six-month period of the whole presidential cycle. In fact, for the S&P 500, it is the only historical 6-month period of the four-year cycle with double-digit returns, as shown in the table below.
At this point in 2023 investors seem to have captured most of that gain, as evidenced by the NASDAQ rising over 17%, and the S&P 500 rising 8%. Given the strong gains we have seen year to date, it would be plausible for the stock market to consolidate some of its gains over the summer months.
Now consider the May-Oct period and in third year of presidencies by sector data. Surprisingly, the growth orientated Technology sector and the opposite-style defensive Utility sector are the two best performing areas historically. Conversely, the weakest areas have been Consumer Cyclical, Energy, and Financials.
In conclusion, the “sell in May and go away” belief is rooted in historical data. In addition, the differential between the November-April period and the May-October period is even more pronounced in the third year of the presidential cycle, in which we currently live. So far, 2023 has played out in line with past patterns. Given the magnitude of the gains and normal seasonality, we would expect a period of digestion during the summer months. Nonetheless, we are optimistic about the stock market’s opportunities as the Fed slows its tightening cycle and US employment remains strong.
Kenley Scott, Director, Global Sector Strategist at William O’Neil + Company, an affiliate of O’Neil Global Advisors, made significant contributions to the data compilation, analysis, and writing for this article.
Read the full article here

