
The stock market, as measured by the S&P 500 Index
SPX,
has bounced off support, but it remains to be seen if this just an oversold rally or if it is the beginning of a new bullish trend. The support came in two forms: the 4200 level (horizontal blue line on the accompanying SPX chart) and the rising 200-day Moving Average of SPX. Oversold rallies typically advance to and slightly above the declining 20-day MA. That is exactly what has happened so far.
An important point on the SPX chart is the gap that was left last month after the FOMC meeting. It is circled on the chart below. If that gap is filled — which would happen if SPX trades at 4401.60 — it would be a meaningfully bullish step for this market. SPX has currently traded into the gap but has not filled it.
While filling the gap would be a positive step, the market would still have to deal with the downtrend line (red line on graph), plus previous resistance points at 4540 and then the July highs at 4600. So, from a strictly chart perspective, SPX is still in a downtrend and has more work to do to overcome that.
However, internal indicators are improving and may provide the impetus needed for a more sustainable rally. A McMillan Volatility Band (MVB) buy signal was confirmed this week (green “B” on the SPX chart). That signal has a target of the +4σ “modified Bollinger Band,” which is currently just below 4500 and still declining at this time. The Band will move, though, as SPX changes in price and as realized volatility changes. This new buy signal would be stopped out if SPX closes below the -4σ Band, which is currently just below 4200, and declining.
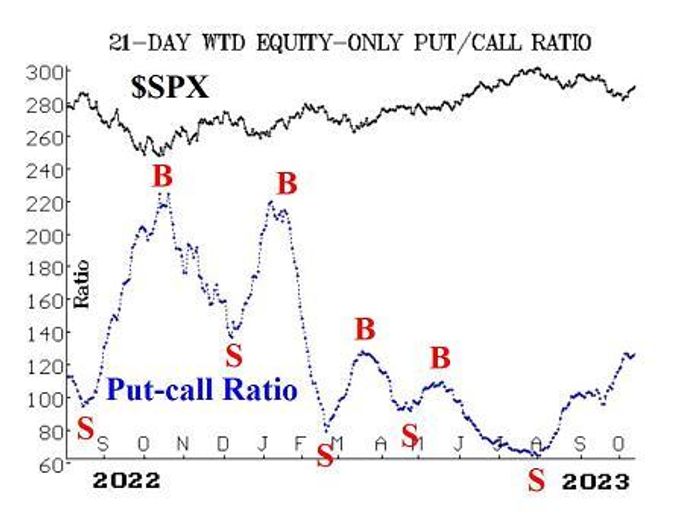
Equity-only put-call ratios have improved a little, but even on this rally there have been periods of heavy put buying. The standard equity-only put-call ratio has rolled over to a buy signal, and that is confirmed by the computer analysis programs that we use to analyze these charts; it is marked with a green “B” on the standard chart. However, the weighted ratio is still in doubt. Furthermore, the Total put-call ratio has moved up to a point where it will issue a buy signal also, but only after it rolls over and begins to decline. That Total ratio, also, is still in doubt.
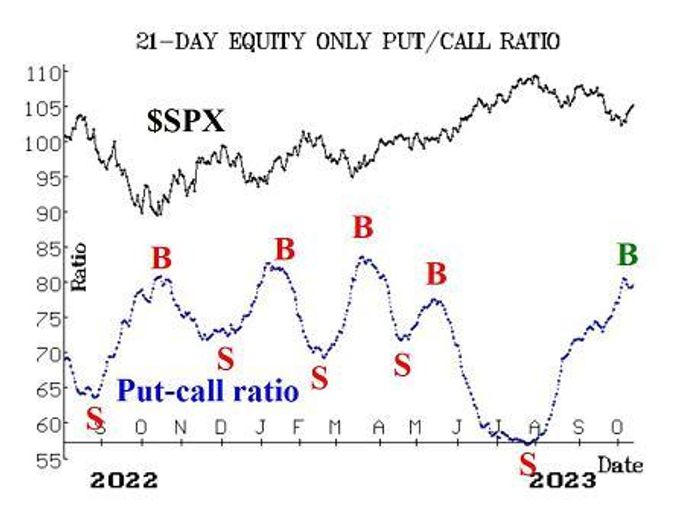
In addition, there is a very rare buy signal in this “sector” that has taken place: the CBOE’s equity-only daily put-call ratio has been above 1.0 twice in recent days, and that is a buy signal. The last time this happened was in March 2020, and although that one was premature, it was a strong buy signal eventually.
Breadth has improved enough so that both breadth oscillators are now on buy signals, too. Earlier in the year, the breadth oscillator signals were sporadic and replete with whipsaws. But this indicator has settled down and given some strong signals in recent months. So, add this to the bullish mix.
New Lows on the NYSE have managed to stay ahead of New Highs (except for one day recently), so this indicator remains bearish. Its sell signal would be stopped out if NYSE New Highs outnumbered New Lows for two consecutive days.
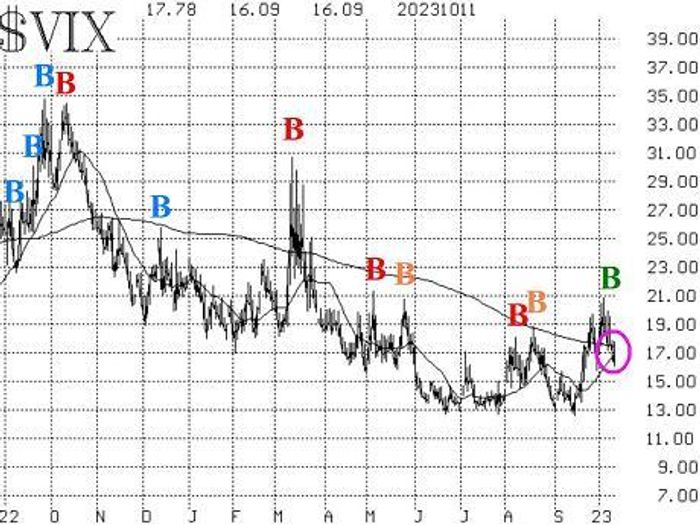
The volatility-based indicators are somewhat bullish, although there are some important days ahead. The “spike peak” buy signal occurred on October 6th, and that is still in place. It will last for 22 trading days, unless stopped out by a VIX close above its recent high at 20.88. At the current time, there is no trend of VIX signal, but as one can see from the accompanying VIX chart, the 20-day Moving Average is advancing strongly on the declining 200-day Moving Average (circled area on the VIX chart). If the 20-day crosses above the 200-day, and VIX is also above the 200-day, that would be a trend of VIX sell signal. We have not seen one of those since September of 2022, so that would be an important intermediate-term negative signal if it were to occur.
Finally, the construct of volatility derivatives remains bullish in its outlook for stocks because the term structures of the VIX futures and of the CBOE Volatility Indices continue to slope upwards.
Overall, we are still maintaining a “core” bearish position as long as that gap on the SPX remains unfilled. However, we are trading other confirmed signals around that “core.”
New recommendation: CBOE equity-only put-call ratio buy signal
This is a rare buy signal. It occurred because the daily CBOE Equity-only put-call readings were above 1.0 twice within a short time period. The main problem with this type of buy signal is that there is no stop for this system. In the distance past, this ratio has been above 1.0 as much as six times within close proximity. The “true” buy signal would be to buy the last one in the sequence, but that is impossible of course, since one never knows which is the last one. So we created this buy signal to buy on the second one. If more come along later, we will most likely not be adding to our position, but there could be some justification for doing just that.
Buy 1 SPY
SPY
Nov (17th) at-the-money call and Sell 1 SPY Nov (17th) call with a striking price 18 points higher. We are holding without a stop initially. Roll the entire spread up if the long side becomes at least eight points in-the-money.
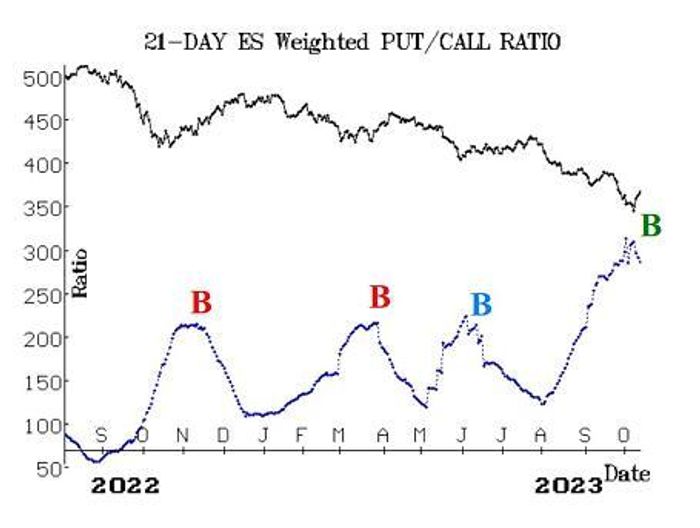
New Recommendation: Eversource Energy (ES)
There is a new weighted put-call ratio buy signal for ES
ES,
so we are going to act on it. Buy 3 ES Nov (17th) 60 calls in line with the market.
ES: 58.96 ES Nov (17th) 60 call: 1.70 bid, offered at 1.90
We will hold this position as long as the weighted put-call ratio chart for ES remains on a buy signal.
Follow-up actions:
All stops are mental closing stops unless otherwise noted.
We are using a “standard” rolling procedure for our SPY spreads: in any vertical bull or bear spread, if the underlying hits the short strike, then roll the entire spread. That would be roll up in the case of a call bull spread, or roll down in the case of a bear put spread. Stay in the same expiration and keep the distance between the strikes the same unless otherwise instructed.
Long 8 CRON
CRON,
Oct (20th) 2 calls: Option volume continues to be very strong. Hold without a stop.
Long 0 EW
EW,
Oct (20th) 70 puts: Stopped out when EW closed above 72.50 on Oct 6th. Overall, this was a strong profit.
Long 1 SPY
SPY
Oct (20th) 428 put: Bought in line with the equity-only put-call ratio sell signals. We are going to hold this put until the weighted ratio rolls over to a buy. Roll down every time this put becomes at least eight points in-the-money.
Long 2 EQR
EQR,
Oct (20th) 60 puts: we will continue to hold as long as the weighted put-call ratio for EQR remains on a sell signal.
Long 3 X
X,
Oct (13th) 31 calls: Hold without a stop while takeover offers are sort out.
Long 3 ADM
ADM,
Oct (20th) 76 puts: The weighted put-call ratio for ADM has rolled over to a buy signal, so sell these puts now to close the position.
Long 1 SPY Oct (20th) 428 put and Short 1 SPY Oct (20th) 408 put: Established in line with the “New Highs vs. New Lows” sell signal. Stop out if New Highs outnumber New Lows on the NYSE for two consecutive days.
Long 3 CHEF
CHEF,
Nov (17th) 20 puts: Lower the trailing stop to 20.70.
Long 2 DLR
DLR,
Nov (10th) 118 puts: We will hold these puts as long as the DLR weighted put-call ratio is on a sell signal.
Long 1 SPY Nov (17th) 430 call and Short 1 SPY Nov (17th) 445 call: This position was bought in line with the VIX “spike peak” buy signal of October 6th. Hold for 22 trading days. Stop yourself out if VIX closes above 20.88.
Long 3 XLE Nov (17th) 86 puts: We will hold as long as the weighted put-call ratio of XLE remains on a sell signal.
All stops are mental closing stops unless otherwise noted.
Send questions to: [email protected].
Lawrence G. McMillan is president of McMillan Analysis, a registered investment and commodity trading advisor. McMillan may hold positions in securities recommended in this report, both personally and in client accounts. He is an experienced trader and money manager and is the author of the best-selling book, Options as a Strategic Investment. www.optionstrategist.com
©McMillan Analysis Corporation is registered with the SEC as an investment advisor and with the CFTC as a commodity trading advisor. The information in this newsletter has been carefully compiled from sources believed to be reliable, but accuracy and completeness are not guaranteed. The officers or directors of McMillan Analysis Corporation, or accounts managed by such persons may have positions in the securities recommended in the advisory.
Read the full article here

