I love dividend-growing companies. Businesses with quality management, great products, and a dedication to rewarding shareholders rank very high on my list. Companies that consistently increase their payouts perform significantly better than those that don’t. As someone who closely monitors these companies, I’m happy to share valuable insights on upcoming dividend increases. With these lists, you can confidently expect to see the top stocks expected to raise their dividends in the upcoming week. I use this analysis for my portfolio construction and actionable items as they come up.
As we are riding into the tail end of the year, one more Dividend King in Emerson Electric offers yet another dividend increase. It’s meager at just about 1%, but it continues its streak of 66 years.
How I Created The Lists
The information presented here is a result of merging two sources of data – the “U.S. Dividend Champions” spreadsheet from this website and upcoming dividend data from NASDAQ. The process involves combining data on companies that have a consistent history of dividend growth with their future dividend payments. It’s important to understand that all companies included in this list have consistently grown in dividends for at least five years.
To be included in this list, companies must have higher total dividends paid out each year. Hence, a company may not increase its dividend every calendar year, but the total annual dividend can still grow.
What Is The Ex-Dividend Date?
The ex-dividend date is the date by which you must have purchased shares to be eligible for the upcoming dividend or distribution. To qualify, you must have bought the shares by the end of the preceding business day. For instance, if the ex-dividend date is Tuesday, you must have acquired the shares by the market close on Monday. It’s important to note that if the ex-dividend date is a Monday (or a Tuesday following a holiday on Monday), you must have bought the shares by the previous Friday.
Dividend Streak Categories
Here are the definitions of the streak categories, as I’ll use them throughout the piece.
- King: 50+ years.
- Champion/Aristocrat: 25+ years.
- Contender: 10-24 years.
- Challenger: 5+ years.
| Category | Count |
| King | 1 |
| Champion | 1 |
| Contender | 9 |
| Challenger | 7 |
The Dividend Increasers List
Data has been sorted by the ex-dividend day (ascending) and then by the streak (descending):
| Name | Ticker | Streak | Forward Yield | Ex-Div Date | Increase Percent | Streak Category |
| Evergy, Inc. | (EVRG) | 20 | 5.18 | 17-Nov-22 | 4.89% | Contender |
| Entergy Corporation | (ETR) | 9 | 4.66 | 13-Nov-23 | 5.61% | Challenger |
| ConocoPhillips | (COP) | 6 | 2.03 | 13-Nov-23 | 13.73% | Challenger |
| Exxon Mobil Corporation | (XOM) | 41 | 3.69 | 14-Nov-23 | 4.40% | Champion |
| Landmark Bancorp Inc. | (LARK) | 22 | 4.75 | 14-Nov-23 | 5.00% | Contender |
| BOK Financial Corporation | (BOKF) | 18 | 3.14 | 14-Nov-23 | 1.85% | Contender |
| Gorman-Rupp Company (The) | (GRC) | 17 | 2.39 | 14-Nov-23 | 2.86% | Contender |
| KLA Corporation | (KLAC) | 14 | 1.14 | 14-Nov-23 | 11.54% | Contender |
| Selective Insurance Group, Inc. | (SIGI) | 10 | 1.35 | 14-Nov-23 | 16.67% | Contender |
| Equinix, Inc. | (EQIX) | 9 | 2.24 | 14-Nov-23 | 24.93% | Challenger |
| Business First Bancshares, Inc. | (BFST) | 5 | 2.75 | 14-Nov-23 | 16.67% | Challenger |
| Microsoft Corporation | (MSFT) | 21 | 0.83 | 15-Nov-23 | 10.29% | Contender |
| Middlesex Water Company | (MSEX) | 20 | 2.05 | 15-Nov-23 | 3.83% | Contender |
| Comfort Systems USA, Inc. | (FIX) | 11 | 0.54 | 15-Nov-23 | 11.11% | Contender |
| HomeTrust Bancshares, Inc. | (HTBI) | 5 | 2.05 | 15-Nov-23 | 10.00% | Challenger |
| Emerson Electric Company | (EMR) | 66 | 2.48 | 16-Nov-23 | 0.96% | King |
| Fidelity D & D Bancorp, Inc. | (FDBC) | 9 | 3.17 | 16-Nov-23 | 5.56% | Challenger |
| Cognex Corporation | (CGNX) | 8 | 0.82 | 16-Nov-23 | 7.14% | Challenger |
Field Definitions
Streak: Years of dividend growth history are sourced from the U.S. Dividend Champions spreadsheet.
Forward Yield: The new payout rate is divided by the current share price.
Ex-Dividend Date: This is the date you need to own the stock.
Increase Percent: The percent increase.
Streak Category: This is the overall dividend history classification of the company.
Show Me The Money
Here’s a table mapping the new rates versus the old rates. It also reiterates the percentage increase. This table is sorted similarly to the first (ex-dividend day ascending, dividend streak descending).
| Ticker | Old Rate | New Rate | Increase Percent |
| EVRG | 0.613 | 0.643 | 4.89% |
| ETR | 1.07 | 1.13 | 5.61% |
| COP | 0.51 | 0.58 | 13.73% |
| XOM | 0.91 | 0.95 | 4.40% |
| LARK | 0.2 | 0.21 | 5.00% |
| BOKF | 0.54 | 0.55 | 1.85% |
| GRC | 0.175 | 0.18 | 2.86% |
| KLAC | 1.3 | 1.45 | 11.54% |
| SIGI | 0.3 | 0.35 | 16.67% |
| EQIX | 3.41 | 4.26 | 24.93% |
| BFST | 0.12 | 0.14 | 16.67% |
| MSFT | 0.68 | 0.75 | 10.29% |
| MSEX | 0.313 | 0.325 | 3.83% |
| FIX | 0.225 | 0.25 | 11.11% |
| HTBI | 0.1 | 0.11 | 10.00% |
| EMR | 0.52 | 0.525 | 0.96% |
| FDBC | 0.36 | 0.38 | 5.56% |
| CGNX | 0.07 | 0.075 | 7.14% |
Additional Metrics
Some different metrics related to these companies include yearly pricing action and the P/E ratio. The table is sorted the same way as the table above. A value investor may find stock ideas with those companies near their 52-week lows, as they could provide more margin of safety and inflated yield. Many of the names are well off their highs.
| Ticker | Current Price | 52 Week Low | 52 Week High | PE Ratio | % Off Low | % Off High |
| EVRG | 49.58 | 46.92 | 63.35 | 19.87 | 6% Off Low | 22% Off High |
| ETR | 96.99 | 87.1 | 117.05 | 15.47 | 11% Off Low | 17% Off High |
| COP | 114.48 | 89.13 | 130.71 | 0 | 28% Off Low | 12% Off High |
| XOM | 102.92 | 96.39 | 120.7 | 52.58 | 7% Off Low | 15% Off High |
| LARK | 17.7 | 16.49 | 24.39 | 6.76 | 7% Off Low | 27% Off High |
| BOKF | 70.09 | 62.42 | 106.47 | 12.65 | 12% Off Low | 34% Off High |
| GRC | 30.17 | 22.63 | 33.56 | 32.51 | 33% Off Low | 10% Off High |
| KLAC | 510.65 | 329.5 | 520.19 | 32.45 | 55% Off Low | 2% Off High |
| SIGI | 103.56 | 83.47 | 108.18 | 19.25 | 24% Off Low | 4% Off High |
| EQIX | 759.7 | 576.37 | 814.13 | 136.86 | 32% Off Low | 7% Off High |
| BFST | 20.34 | 12.79 | 23.72 | 14.97 | 59% Off Low | 14% Off High |
| MSFT | 363.17 | 217.86 | 366.01 | 34.57 | 67% Off Low | 1% Off High |
| MSEX | 63.44 | 61.67 | 94.33 | 32.4 | 3% Off Low | 33% Off High |
| FIX | 185.17 | 110.86 | 192.33 | 13.39 | 67% Off Low | 4% Off High |
| HTBI | 21.5 | 17.85 | 30.5 | 16.17 | 20% Off Low | 30% Off High |
| EMR | 84.76 | 76.52 | 100.62 | 24.44 | 11% Off Low | 16% Off High |
| FDBC | 48.02 | 35.24 | 52.41 | 23.72 | 36% Off Low | 8% Off High |
| CGNX | 36.58 | 34.28 | 59.42 | 72.07 | 7% Off Low | 38% Off High |
Tickers By Yield And Growth Rates
I’ve arranged the table in descending order for investors to prioritize the current yield. As a bonus, the table also features some historical dividend growth rates. Moreover, I have incorporated the “Chowder Rule,” which is the sum of the current yield and the five-year dividend growth rate.
| Ticker | Yield | 1 Yr DG | 3 Yr DG | 5 Yr DG | 10 Yr DG | Chowder Rule |
| EVRG | 5.18 | 7 | 6.7 | 8.1 | 6.2 | 13 |
| LARK | 4.75 | 6.2 | 6.7 | 6 | 6.1 | 10.7 |
| ETR | 4.66 | 6 | 4.8 | 3.8 | 2.6 | 8.4 |
| XOM | 3.69 | 3.4 | 1.5 | 2.7 | 4.3 | 6.4 |
| FDBC | 3.17 | 9.1 | 8.7 | 8.5 | 8 | 11.6 |
| BOKF | 3.14 | 1.9 | 1.9 | 3.2 | 3.6 | 6.3 |
| BFST | 2.75 | 0 | 6.3 | 24.6 | 27.3 | |
| EMR | 2.48 | 1 | 1.3 | 1.4 | 2.4 | 3.9 |
| GRC | 2.39 | 3 | 6.5 | 7 | 8.2 | 9.4 |
| EQIX | 2.24 | 9.5 | 8.5 | 8.6 | 10.9 | |
| MSEX | 2.05 | 7.8 | 6.8 | 6.9 | 5.3 | 8.9 |
| HTBI | 2.05 | 11.1 | 12.6 | |||
| COP | 2.03 | -32.9 | 6.7 | 12.8 | -2.7 | 14.8 |
| SIGI | 1.35 | 7.2 | 9.3 | 10.8 | 8.7 | 12.1 |
| KLAC | 1.14 | 16.9 | 14.7 | 14.2 | 12.2 | 15.4 |
| MSFT | 0.83 | 9.7 | 10.1 | 10.1 | 11.5 | 10.9 |
| CGNX | 0.82 | 7.7 | 8.4 | 9.2 | 17.7 | 10 |
| FIX | 0.54 | 38.9 | 21.8 | 19 | 13.9 | 19.5 |
Historical Returns
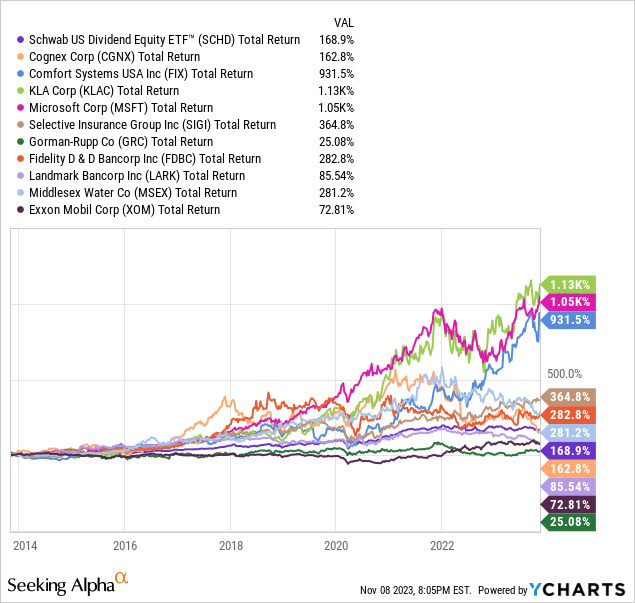
My investment strategy involves finding stocks combining increasing dividends and consistently outperforming the market. I use the Schwab U.S. Dividend Equity ETF (SCHD) as my dividend growth benchmark. This ETF has a remarkable track record of exceptional performance, a higher yield than the S&P 500, and a proven record of growing dividends. Investing in the ETF is better if a stock cannot beat the benchmark. I have added companies to my personal investment portfolio based on this analysis.
Here’s the total return chart of SCHD versus the top 10 highest 10-year dividend growth rate companies. For reference, SCHD was up about 169%. The top three performers were FIX, MSFT, and KLAC. The return profiles aren’t even close; those three were up about 10x in the past decade. In fact, because of this research, I added FIX to my own portfolio last year.
After that, a combination of SIGI, FDBC, and MSEX performed exceptionally well. Those three still bested SCHD by many points per year.
Finally, CGNX mirrored SCHD’s returns, but LARK, XOM, and GRC trailed considerably.
Please do your due diligence before investing, and thanks for reading.
Editor’s Note: This article discusses one or more securities that do not trade on a major U.S. exchange. Please be aware of the risks associated with these stocks.
Read the full article here

