Part I: Introduction
Johannesburg-based AngloGold Ashanti Limited (NYSE:AU) released its H1 2023 results ending June 30, 2023, on August 4, 2023.
Note: This article updates my previous article on AngloGold Ashanti, published on October 17, 2022. I have been following AU’s regularly since December 2020.
AngloGold Ashanti owns a diversified asset portfolio, with Tier 1 assets representing 61.8% of the total yearly input.
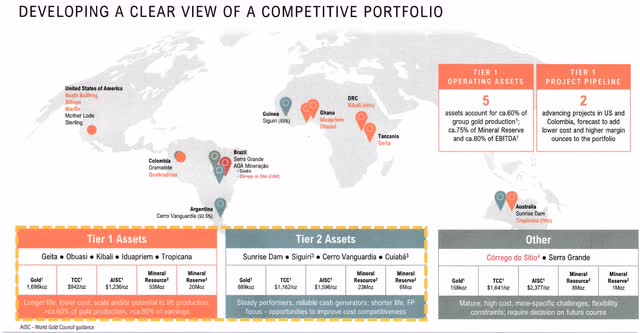
AU Map Assets from September Presentation (AU Presentation)
Reminder: AngloGold Ashanti relocated its major listing from the Johannesburg Stock Exchange (JSE) to New York on May 12, 2023, in order to get access to a wider capital market and lower the risk associated with South Africa.
1: H1 2023 Results and Commentary
Revenue for H1 2023 was $2,186 million with an adjusted EBITA of $678 million. Net income was $40 million, or $0.10 per diluted share.
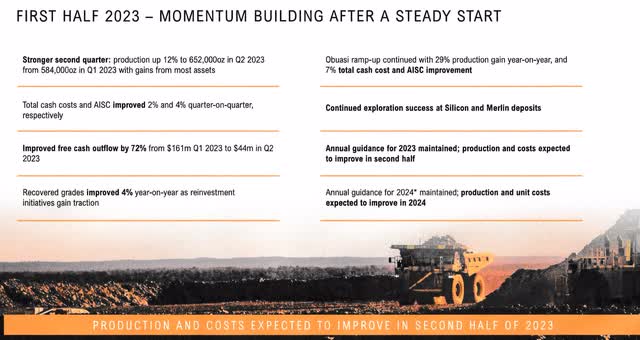
The company reaffirmed its 2023 guidance as it reported improved second-quarter performance compared to the first three months of the year, with a 12% increase in production.
AU H1 2023 Overview (AU Presentation)
Production per region in H1 2023:
1.1: Africa
Operations produced 713K Au Oz at a total cash cost of $1,105/oz for the six months ended June 30, 2023.
The production of gold at Iduapriem Mine in Ghana was 118K oz for the six months that ended on June 30, 2023, at a total cash cost of $1,004/oz, as opposed to 115K oz at a total cash cost of $1,028/oz for the same period in 2022. Since the mine has access to better-grade ore from Teberebie Cut 2, gold production has increased year over year.
Also, the Obuasi redevelopment project’s Obuasi Phase 3 achieved 82% overall completion in the first half of 2023.
1.2: Latin America
The Americas operations produced 258K Au Oz at a total cash cost of $1,313/oz for the period ending on June 30, 2023.
1.3: Australia
The Australia operations produced 265K Au Oz at a total cash cost of $1,296/oz for the period ending on June 30, 2023.
At Sunrise Dam, gold output for the six months that ended on June 30, 2023, was 127K oz at a total cash cost of $1,304/oz, up from 117K oz at a total cash cost of $1,377/oz for the same time in 2022.
The improvement in mill feed grades and metallurgical recoveries, which led to a 9% increase in recovered grade, were the key factors in the increase in gold production year over year.
1.4: Nevada Projects: The Beatty District
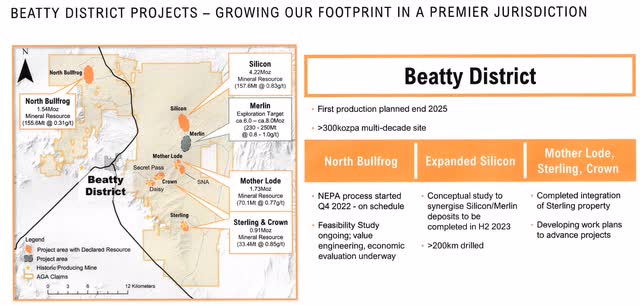
AU Beatty District (AU Presentation)
The project includes the North Bullfrog, the Expanded Silicon, Mother Lode, Sterling, and Crown. The first production is planned for the end of 2025, with an annual input of 300,000 oz.
2: Stock performance
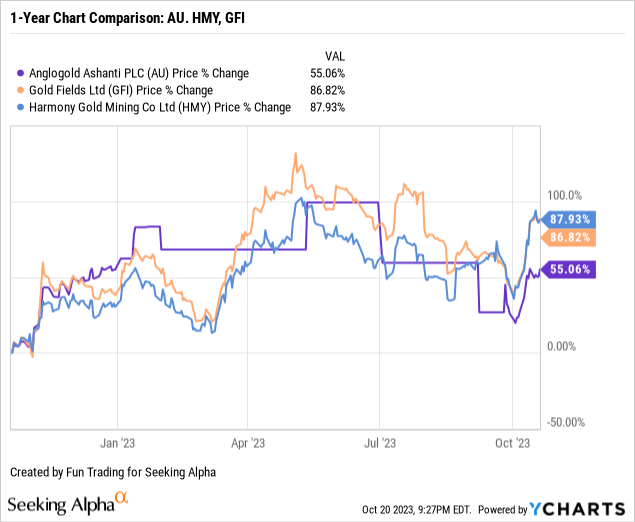
I regularly cover three gold miners mining in South Africa: AngloGold Ashanti, Harmony Gold (HMY), and Gold Fields Ltd. (GFI).
AngloGold Ashanti has underperformed its peers. Still, the stock is now up 55% on a one-year basis.
Part II: Global Presentation and Gold Production
1: H1 2023 Gold production
1.1: H1 2023 Production
AngloGold Ashanti sold 1,246K Au Oz in H1 2023 and produced 1,236K Au Oz. Production was up 0.2% from H1 2022.
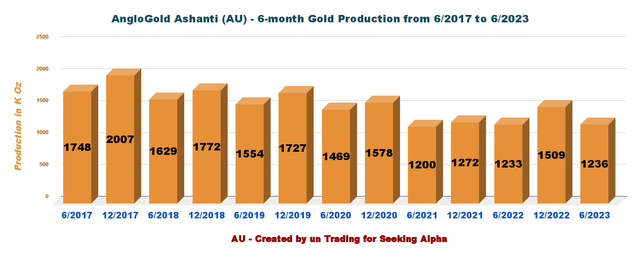
AU 6-month Gold Production History (Fun Trading)
After a difficult first quarter in 2023, production rose in the second quarter at Kibali (38%), Geita (21%), AGA Mineraço (63%), Serra Grande (47%), Sunrise Dam (8%), and Tropicana (16%) compared to the first quarter.
The carbon-in-leach tank failure at the Siguiri mine has since been repaired. During the second quarter, total cash costs per ounce were 2% lower than in the first quarter of 2023.
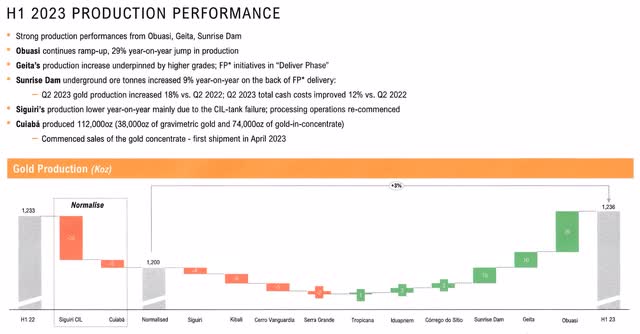
AU H1 2023 Production Performance (AU Presentation)
1.2: Quarterly Production per Mine, Comparison H1 2022 with H1 2023
The company produced gold from ten different mines:
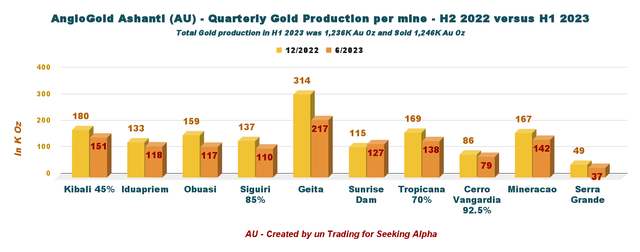
AU 6-month Gold Production per Mine. H1 2022 versus H1 2023 (Fun Trading)
Strong contributions from most of the portfolio helped support the significant increase in gold production from quarter to quarter.
These contributions included production increases of 38% at Kibali, 21% at Geita, 63% at AGA Mineraço, 47% at Serra Grande, 8% at Sunrise Dam, and 16% at Tropicana. The lower production at Siguiri as a result of the CIL tank failure (which has since been rebuilt) somewhat offset this gain in output.
2: All-in Sustaining Costs and Gold price realized
All-in-sustaining cost (AISC) was $1,587 per ounce in H1 2023. An increase of 11.9% from H1 2022
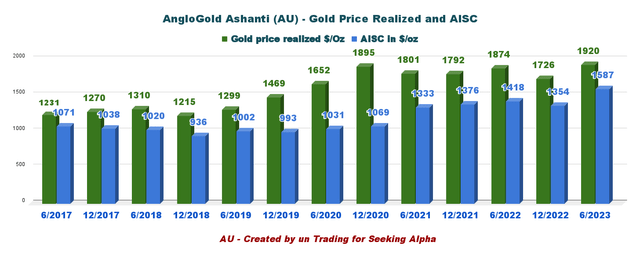
AU 6-month Gold Price and AISC History (Fun Trading)
Part III: AngloGold Ashanti: Balance Sheet and Production H1 2021 to H1 2023: The Raw Numbers
Note: Like most South African gold and PGM miners, full results are posted only every six months, complicating the analysis.
| AU 6-month | 6/2021 | 12/2021 | 6/2022 | 12/2022 | 6/2023 |
| Total Revenues in Millions (6 months) | 1,965 | 2,064 | 2,155 | 2,346 | 2,186 |
| Net Income in $ million (6 months) | 362 | 260 | 298 | -1 | 40 |
| EBITDA: $1 Million (6 months) | 775 | 724 | 702 | 569 | 452 |
| EPS diluted in $/share (6 months) | 0.86 | 0.62 | 0.71 | 0.00 | 0.10 |
| Cash from operating activities in $ million (6 months) | 467 | 801 | 992 | 812 | 293 |
| Capital Expenditure in Millions (6 months) | 429 | 598 | 434 | 594 | 453 |
| Free Cash Flow in $ million (6 months) | 38 | 202 | 558 | 218 | -160 |
| Total Cash in Millions (6 months) | 1,081 | 1,154 | 1,266 | 1,108 | 722 |
| LT Debt (incl. current) in dollars (6 months) | 1,929 | 1,909 | 2,005 | 1,985 | 1,918 |
| Shares outstanding (diluted) in Million (6 months) | 419.05 | 420.06 | 420.06 | 418.31 | 421.08 |
| Dividend yearly | 0.15 | – | 0.29 | 0.18 | |
| Gold Production | 6/2021 | 12/2021 | 6/2022 | 12/2022 | 6/2023 |
| Total Gold production in K Oz | 1,200 | 1,272 | 1,233 | 1,509 | 1,236 |
| Gold production sold in K Oz | 1,214 | 1,269 | 1,233 | 1,484 | 1,246 |
| Gold Price Realized: $/Oz | 1,801 | 1,792 | 1,874 | 1,726 | 1,920 |
| AISC in $/oz | 1,333 | 1,376 | 1,418 | 1,54 | 1,587 |
Source: Company filings
AngloGold Ashanti: Balance sheet details
1: Revenues and Trends: Revenues were $2,186 million in H1 2023
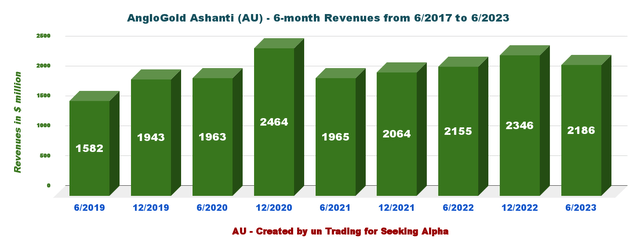
AU 6-month Revenue History (Fun Trading)
The revenue for H1 2023 was $2,186 million. Net income was $40 million, or $0.10 per diluted share. It compares to revenue of $2,155 million, or $0.71 per diluted share, in H1 2022.
Note: The losses of $141 million in the first half of this year’s basic earnings were mostly attributable to derecognitions and impairments in the Brazil portfolio.
Adjusted EBITDA for H1 2023 was $678 million, compared with $864 million in H1 2022. During the first half of 2023, the Kibali joint venture paid $37 million in cash to AngloGold Ashanti.
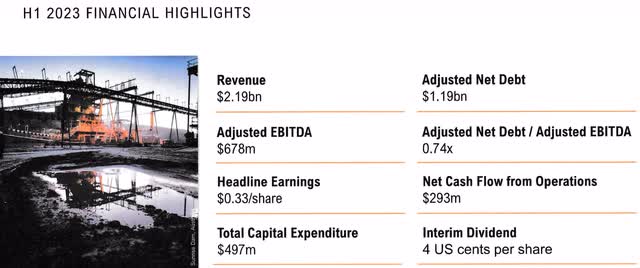
AU Financial Highlights (AU Presentation)
2: Free cash flow was negative $160 million in H1 2023
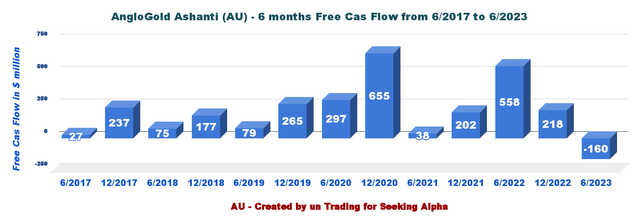
AU 6-month Free Cash Flow History (Fun Trading)
Note: Cash from operations less capital expenditures constitutes generic free cash flow. AngloGold Ashanti has a different way of calculating the free cash flow and indicated a negative $205 million in H1 2023.
Trailing 12-month free cash flow was $58 million, with a negative $160 million in H1 2023.
The company declared an interim dividend of $0.04 per share.
3: AngloGold Ashanti’s debt situation is stable and solid.
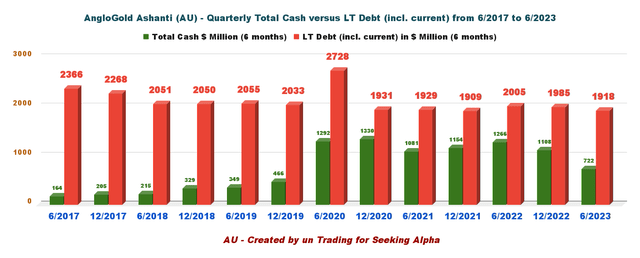
AU 6-month Cash versus Debt History (Fun Trading)
At the end of June 2023, there was $722 million in total cash and $1,918 million in long-term debt. There is $2.3 billion in liquidity available.
The balance sheet remained robust following the payout of the final 2022 dividend at the end of June 2023.
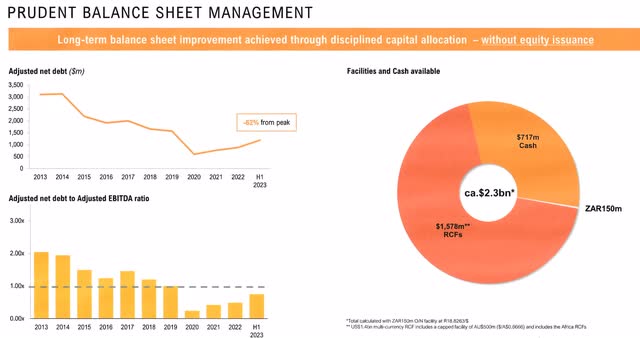
AU Balance Sheet (AU Presentation)
4: 2023-2024 Guidance
2.45 to 2.61 million ounces of gold are anticipated to be produced in 2023, with an AISC of $1,405 to $1,450 per ounce. Production is anticipated to rise from 2.530 to 2.730 mL in 2024.
CapEx will be between $0.96 billion and $1.07 billion, staying constant in 2024.
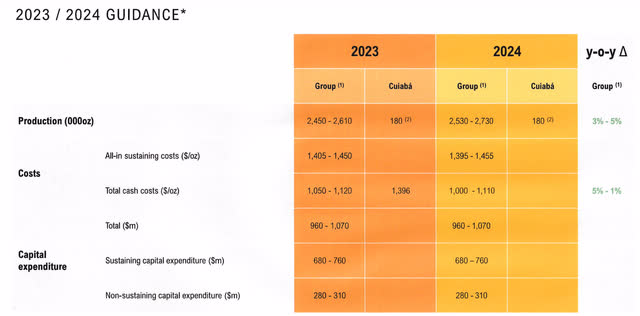
AU 2023 Guidance (AU Presentation)
Part IV: Technical Analysis and Commentary
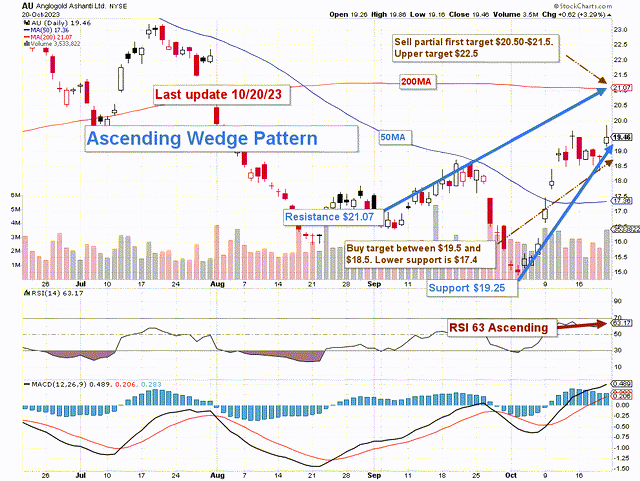
AU TA Chart (Fun Trading StockCharts)
Note: The chart has been adjusted for dividends.
AU forms an ascending or rising wedge pattern with resistance at $21.07 and support at $19.25. It is important to notice that RSI is now over 60, meaning the stock is beginning to be overbought.
A rising wedge is a bearish chart pattern (said to be “of reversal”). It is formed by two converging bullish lines. A rising wedge is confirmed/valid if it has good oscillation between the two bullish lines. The upper line is the resistance line; the lower line is the support line. Each of these lines must have been touched at least twice to validate the pattern.
Since my previous article, AngloGold Ashanti has continued to pursue the same broad plan. I advise maintaining a core long-term stake and trading short-term LIFO at roughly 50%–60% with a $30 end goal.
I advise trading the channel for this most recent report, which is valid for a week, by selling between 50% and 60% of your position between $20.5 and $21.5, with potential higher support at $22.5, and accumulating between $18.5 and $19.5, with potential lower support at $17.4.
Warning: For it to be useful, the TA chart needs to be updated frequently. The chart above may be relevant for up to a week. Remember that the TA chart is merely a tool to assist you in choosing the appropriate course of action. It is not a method for predicting the future. Nobody or anything can.
Read the full article here

