When I last covered Avalanche (AVAX-USD) in early January, I noted there were positive signs despite a lack of growth in network activity. Those positive signs included attractive valuation metrics compared to peers. In this Avalanche update, I’ll provide an updated look at some of the activity and valuation metrics I’ve been sharing with BlockChain Reaction subscribers over the last few weeks.
Network Activity
Total transactions on Avalanche more than doubled from 4.2 million in March to over 9.3 million in April. The transaction growth trend continued in May with a 32% month-over-month increase to 12.3 million transactions. Looking at the daily transaction data from IntoTheBlock on the same chart as AVAX price really shows the divergence between AVAX and the activity on the network. This is unusual considering there has been a clear correlation between the two in the past and AVAX is the gas utility token of the network.
Avalanche (Into The Block)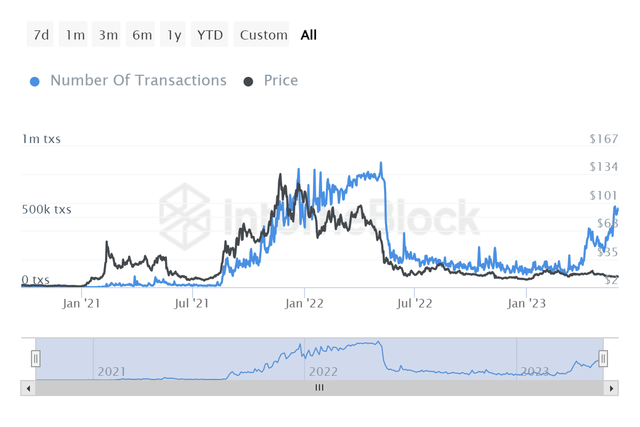
Going back through more than two and half years of network history, we’ve rarely had such a large divergence in daily transactions and price as we do right now. The last time the divergence was this large was in May 2022 before the Terra (LUNC-USD) collapse. At that time, the divergence started when activity and price were both near highs, this time we have the opposite. Daily average transactions have doubled over the last several weeks, and AVAX’s token price simply isn’t reflecting that move. This is fairly unique to non-Ethereum (ETH-USD) ecosystem chains.
From a daily user standpoint, the activity spike is very evident compared to other alternative networks:
Daily Active Users (Token Terminal)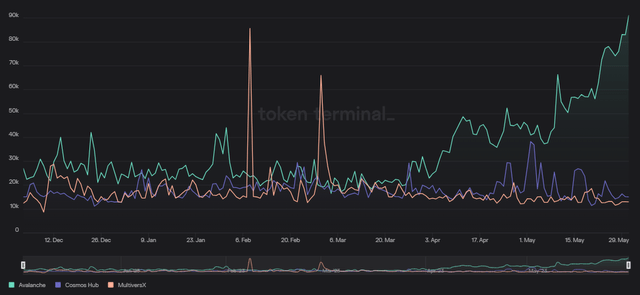
When we look at daily active users over the last 6 months through Token Terminal, Avalanche is a standout versus chains like Cosmos Hub (ATOM-USD) or MultiversX (EGLD-USD) as those networks don’t have sustained increases in DAUs that started in early April. I picked these two chains as comps because they share a similar DAU baseline and help illustrate that it is indeed something unique to Avalanche that is taking place.
Finding where that activity is coming from is always part of the challenge. Much of it is probably explained by the NFT sales on Avalanche. That figure has spiked roughly 600% from just under 400k in March to over 2.7 million in April. May saw over 2 million NFT sales as well but came in slightly under the April total:
Avalanche NFTs (Dune Analytics/subinium)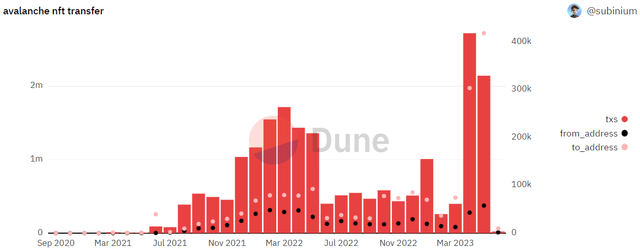
Elsewhere, Avalanche’s deployed contracts made an absolutely enormous jump higher over the last two months as well:
Avalanche Contracts (Dune Analytics/subinium)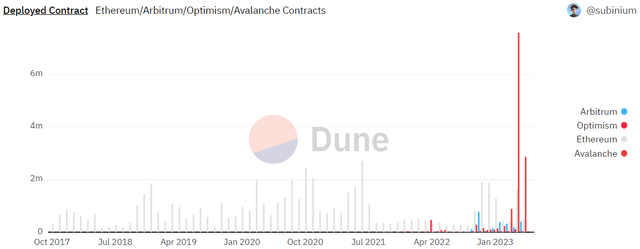
Month-over-month deployed contracts moved up from 887k in March to nearly 7.6 million in April – which is more contracts deployed on Avalanche than on Ethereum, Arbitrum (ARB-USD), and Optimism (OP-USD) combined. That figure came down to a little under 3 million in May. But the activity on the chain remains highly elevated compared to previous levels.
Valuation
From a valuation standpoint, things are a bit more mixed. In my last Avalanche article, we looked at price to sales ratios and market cap to TVL ratios for chain comparisons. From a DeFi standpoint, you could argue Avalanche is actually a bit more expensive compared to January when it had an MC/TVL ratio now near 4:
| TVL Rank | Network | Protocols | TVL | Stables | MC/TVL |
|---|---|---|---|---|---|
| 1 | Ethereum | 807 | $27.22b | $68.94b | 8.28 |
| 2 | Tron | 22 | $5.58b | $45.21b | 1.22 |
| 3 | Binance | 606 | $4.44b | $5.68b | 10.87 |
| 4 | Arbitrum | 343 | $2.36b | $1.83b | 0.63 |
| 5 | Polygon | 425 | $1.02b | $1.53b | 8.17 |
| 6 | Optimism | 142 | $884.24m | $607.69m | 1.02 |
| 7 | Avalanche | 307 | $705.93m | $1.33b | 6.94 |
| 8 | Mixin | 9 | $403.67m | $29.34m | |
| 9 | Cronos | 98 | $341.93m | $5,860 | 4.37 |
| 10 | Pulse | 6 | $336.21m |
Source: DeFi Llama
That figure is now closer to 7. However, despite the increase in MC/TVL Avalanche is still cheaper than Polygon (MATIC-USD), Binance (BNB-USD), and Ethereum by comparison. Switching from pure DeFi valuations to a more all-encompassing network activity figure, we can look at the updated price to sales comps:
Fully Diluted P/S (Token Terminal)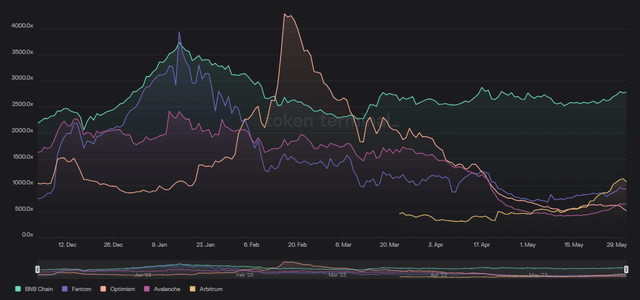
Here we see AVAX is now trading at 642 times sales. This is a big improvement from the 2000x multiple where AVAX was trading in early January, and it makes it one of the cheaper L1 networks by fully diluted P/S after Ethereum and Optimism. AVAX is now cheaper than Binance, Fantom (FTM-USD), and Arbitrum.
Risks
Avalanche remains an inflationary token at this juncture. Even though the coin supply does have a cap, that supply won’t be fully unlocked until 2030. Due to the somewhat low 48% circulating supply compared to other competing alternative Layer 1 networks, holders may want to consider some form of yield generation on their AVAX to combat that inflation. According to Staking Rewards, network delegators can currently generate a 7.55% APR – this represents a 1.7% real yield when adjusting for the token dilution.
Additionally, AVAX carries many of the same risks that are standard throughout much of the public blockchain network industry. Those risks include regulatory uncertainty and lackluster demand for cryptocurrencies and digital assets over the last year. However, Avalanche appears to be bucking that demand trend more recently.
Summary
In my January AVAX article, I concluded Avalanche was interesting but that it would take real network growth to change my view that the native coin of the chain is a hold:
Though I do not currently have any exposure to AVAX, it is a token that I’ve previously owned a very small portion of and I would entertain going long AVAX again at some point in the future if the network activity warranted such a move.
Shortly after that article, Avalanche’s core developer announced a partnership with Amazon (AMZN). 5 months later, we are seeing the network activity story changing. Transactions on Avalanche’s C-Chain are now at levels that haven’t been achieved in over a year. More importantly, though, the last time Avalanche had network activity of this magnitude, the price of AVAX was closer to $80 per coin. Even when adjusting for the 32% supply dilution over the last 18 months, I think AVAX has some catching up to from a price per coin standpoint.
Read the full article here


