
Summary
We are initiating Bio-Rad (NYSE:BIO) with a buy rating. Given the ongoing weakness in the share prices, our Cash Flow Returns On Investments analysis points to a potential upside of 24% for FY23 and increasing to 33% for FY24.
The Company
Bio-Rad operates in life science research and the clinical diagnostic markets. Revenue generated from these segments is split roughly equally. 41% of net sales are from the domestic market and the rest internationally, predominantly from Europe.
Bio-Rad manufactures and supplies the life science research, healthcare, analytical chemistry and other markets with a broad range of products and systems used to separate complex chemical and biological materials and to identify, analyze and purify their components.
Financials
Bio-Rad is not exactly a high-growth company, but it is consistent. Long-term revenue growth, the 15-yr compound annual growth rate has been approximately 4.1% and earnings over the same period have grown 10.6%. Evidently, margins have improved during the same period.
Bio-Rad Laboratories Financial Summary (ROCGA Research)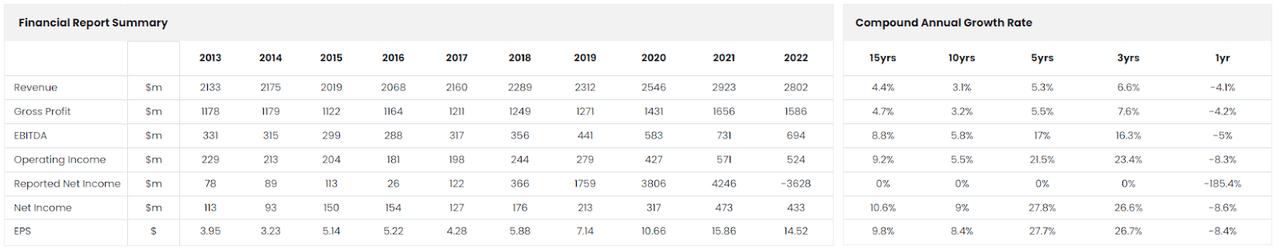
During the pandemic, the company benefited from increased demand, primarily in PCR (Covid testing), as well as the biopharma segment. Revenues increased in FY20 by 10% and 15% in FY21. FY22 saw a decrease in revenue of 4.1%. If we exclude covid related sales, revenues grew modestly by 1.4%. The same applies to the more recent results. Looking at the latest Q2 numbers, net sales decreased by 1.45%, however, the Clinical Diagnostics segment saw an increase of 3.3%, and life science excluding Covid-related sales saw an increase of 4.5%. If we exclude Covid related sales, this translates to an overall increase in revenues of 3.4%.
Let’s now look at the balance sheet’s strengths and weaknesses. The company as of 30 June 2023, had $1.2bn of outstanding debt and cash and investments at hand of $1.7bn giving it negative net debt. This gives BIO the option to gear up and expand when the option arises. This can be organic or acquisitions.
It also holds a stake in Sartorius valued at $7.3bn. The most recent reported book value for BIO is $8.5bn. This gives a P/B value of 1.35x, a discount to the industry average of 2.13x. If required, liquidating its investment in Sartorius can be challenging.
The Gross Cash, a standardized calculation of a company’s cash-generating ability, has been increasing at a healthy rate of 7.7% CAGR over 15 years.
The current guidance for full-year FY23, non-GAAP, excluding Covid-related and currency-neutral revenue growth is 4.5%. Reported GAAP revenues are expected to be flat, and the consensus is forecasting growth to be back on track in FY24. Consensus is estimating EPS to be down 12% for FY23, but increasing again by 12% in FY24.
BIO’s share price has been punished this year by the fact that management has been downgrading the FY23 outlook over the last two quarters. In Q1 results, guidance for non-GAAP currency-neutral revenue growth was lowered to 4.5% compared to its previous estimate of 6% to 7%. This revision resulted in prices closing down 16.7% at $385 and bottomed out at $358 over the next few days. In Q2 results, the estimated FY23 revenue growth was reduced further by management to 0.8%. The market hardly reacted to this downgrade.
With clients spread across the globe, BIO faces foreign exchange risk, but we think this can only be transitory and will not affect the long-term prospects. The company also faces challenges with the supply of raw materials and components used in its products. These delay the development of new products as well as cause a backlog of sales orders. The company has also experienced an increase in raw material costs. Though these issues are moderating, the challenges still exist.
Conventional Valuation
The sector average PE is 20x for FY1 and if we use that against BIO’s FY1 consensus EPS of 12.68, we get a warranted share price of $254. To value BIO, we need to include its investment in Sartorius where it owns 37% of the outstanding ordinary shares and 28% of preferred shares. This is valued at approximately $7.3bn in total (30 June 2023), and this equates to $249 per BIO share. If we add this to $254, we get a total warranted value of $503. Also, a point to note, the share price of Sartorius has gone up around 10% to date.
Reversing Sartorius out of BIO’s current share price of $401.5, Bio standalone is worth $152.5 per share. That gives us an FY1 PE of 12.1x, a significant discount to the sector average of 20x.
The Value Drivers
Let us now try and identify the value drivers, similar to a DuPont-like breakdown. The secret of long-term value generation is growth, efficiency, and margins. We have already looked at revenue growth. For efficiency, we will use gross asset turnover along with operating margins.
BIO Operating Margin (ROCGA Research)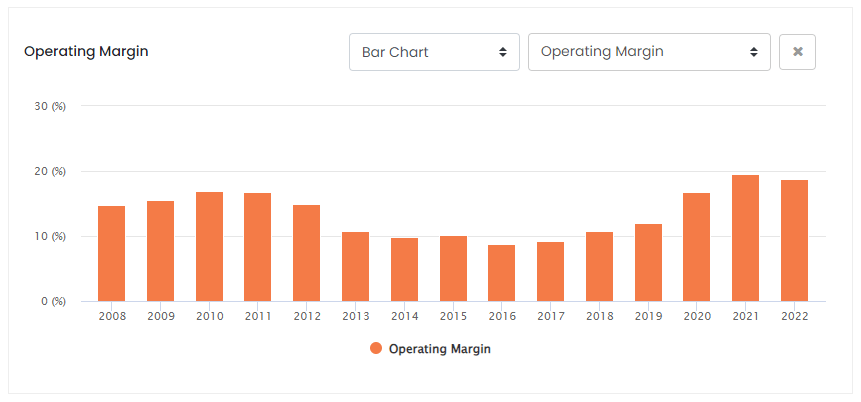
We can see that the most recent margins are significantly higher and management expected the operating margin for FY23 to be around 16%. Even though this is lower, it is higher than the 15 years historic average.
BIO Gross Asset Turnover (ROCGA Research)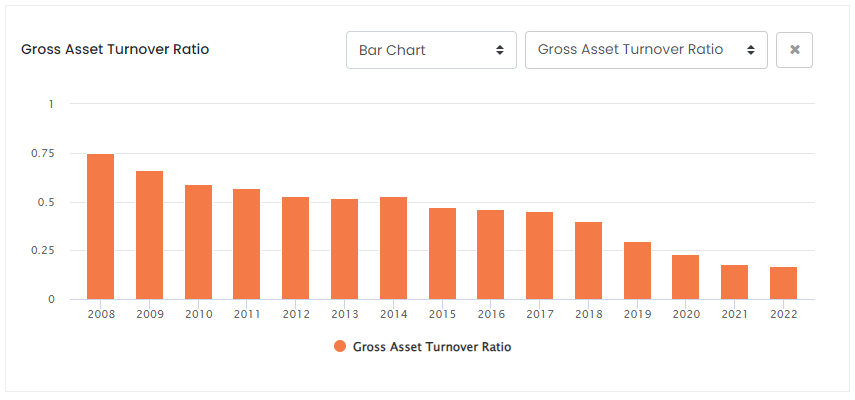
In this case, the asset turnover is a little deceiving as BIO marks to market the fair value of its investment in Sartorius. This was $8.5bn for FY22 and accounts for approximately 63% of the total assets without contributing to the reported revenues. Asset turnover is the ratio of assets required to generate revenues. Excluding the investments in Sartorius, the asset turnover would be significantly higher at 0.56x. This in return would affect any returns on assets calculations.
BIO Returns On Cash Generating Assets (ROCGA Research)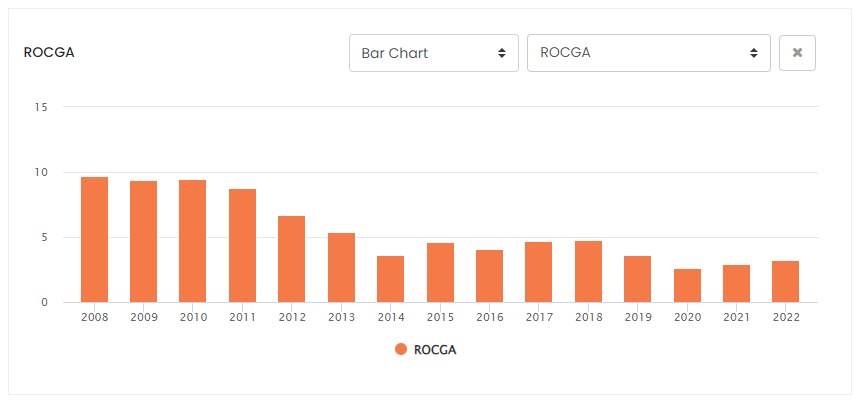
Cash Flow Returns On Investments Valuation
To value a company, we use our affiliate ROCGA Research’s quantitative and systematic Cash Flow Returns On Investments based DCF valuation and modeling tools. The first step involves modeling the company, back-testing the valuation for correlation with the historical share prices, and using that same model to forecast forward.
Value is a function of returns and growth in cash-generating assets. The total value of the company takes into account the present value of existing assets and the present value of growth. Where the returns are lower due to the increasing mark to market of Sartorius, a more significant portion of the valuation consists of the PV of existing assets, in other words, Sartorius.
BIO Default Valuation (Valuation chart created by the author using ROCGA Research platform)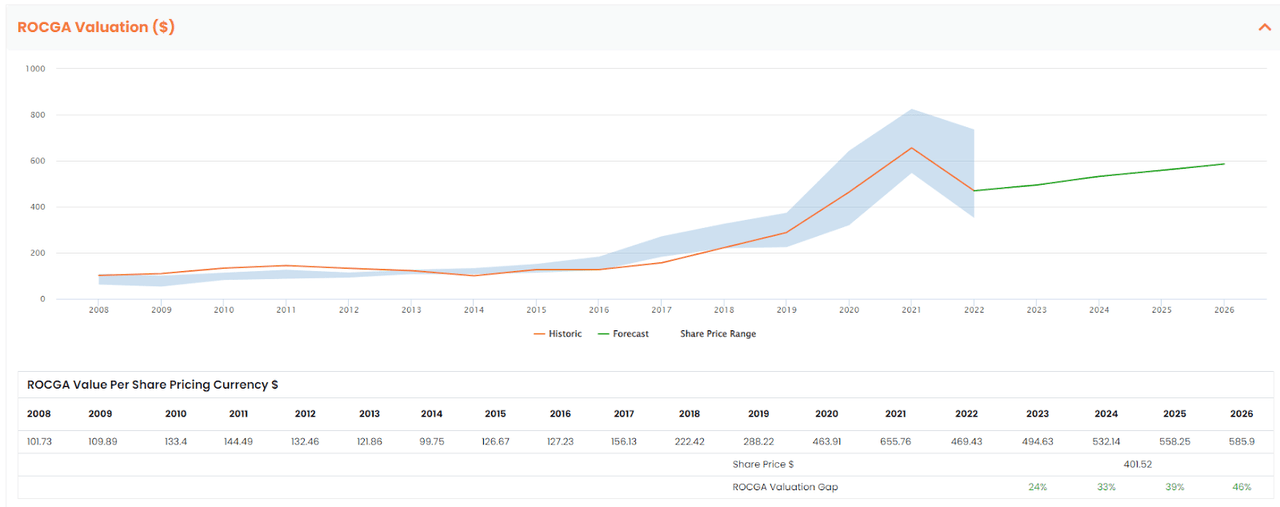
The blue band above represents the share price highs and lows for the year and the orange line is the DCF model-driven historic valuation. The green line is the forecast warranted value derived using the same model along with consensus earnings and default self-sustainable organic growth of 2.5%. For the EPS in FY25 & FY26, we assume a modest 2.5% increase.
If you look closely, you will see a pattern in how the margins, returns, and asset growth contribute to the value per share of the company.
Historically, we see a high correlation between the share price range and model-driven valuation. We project forward and the default valuation is pointing to a potential upside of 24% for FY23 and increasing to 33% for FY24.
There are some risks involved with this company, as mentioned above, including an increase in raw material costs, their availability, as well as the microeconomic environment remaining challenging over the short to mid term. To stress test, we reduce growth used in the DCF model from 2.5% to 0%, and add 1% to the weighted average cost of capital. This still gives a potential upside of 4% for FY23 and 10% for FY24. This points to limited downside risk.
Conclusion
BIO is trading at a discount to its warranted value. At these low prices, the potential upside is in excess of 24% with limited downside. We are initiating with a buy rating and a conservative target of $495.
Macroeconomic headwinds exist, but given the weakness in the share price, this is a good time to go long in BIO stock.
Read the full article here

