
Let’s go through some charts. At the end of this run-down, there is one broad area that stands out to me. (And I think you know what it is based on the featured ETF of this article).
First, the S&P 500 continues to trade just under key resistance near 4200. The problem here is that last August’s false breakout remains a challenge for domestic large caps.
SPY: US Large Caps Wobble Under the August 2022 Peak
Stockcharts.com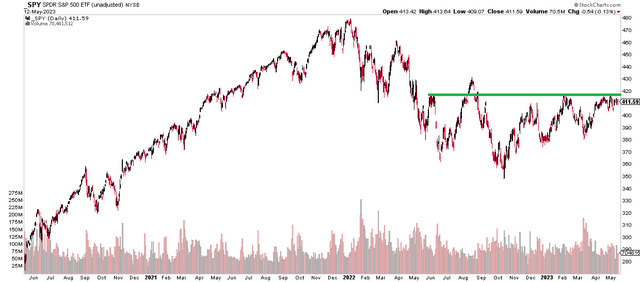
Outside the large-cap space, VXF (which gauges all US equities ex-large caps) remains more than 20% off its 2021 peak and is perhaps the worst-looking chart of all the major sub-asset groups outlined in this missive. Poor breadth continues to be a challenge for the domestic market.
VXF: US Market (Ex-Large Caps) Not Far From New Lows
Stockcharts.com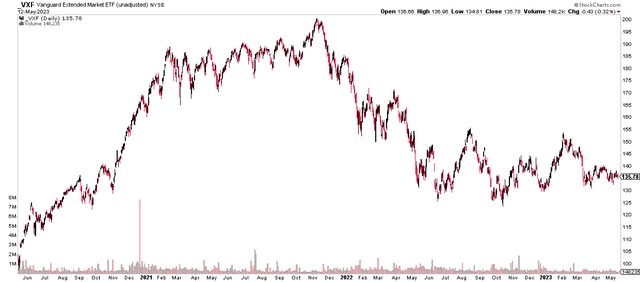
Foreign stocks, meanwhile, look much better to me. Notice that the all-world ex-US index, as measured by VEU is a lot like that of the SPX, but it does not have that August 2022 false breakout issue to work through on a breakout.
VEU: Total International Market Hovers Below Resistance
Stockcharts.com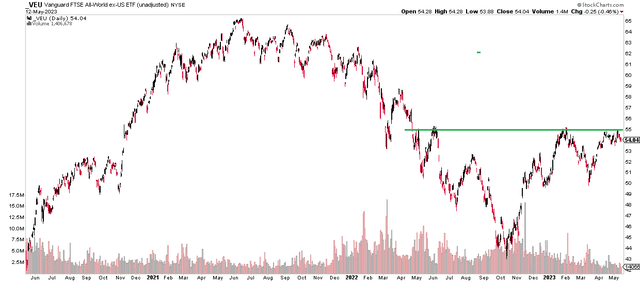
Homing in on emerging markets, the VWO ETF has sharply underperformed VEU. It is currently in an important consolidation position – the apex of a symmetrical triangle is nearing. This is definitely one to watch from a risk-on, risk-off perspective.
VWO: Emerging Markets Show a Bearish Consolidation
Stockcharts.com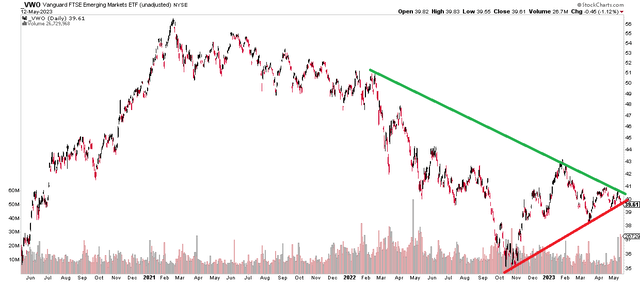
So that brings us to my favorite chart – VEA. The Vanguard FTSE Developed Markets Index Fund (NYSEARCA:VEA) hovers around its 52-week highs and is closer to its 2021 peak than it is to the October 2022 low. Amid a weakening US dollar, established and somewhat defensive international large caps (ex-EM) have fared fine. And they are under the radar compared to the US mega cap growth, which is constantly in the spotlight.
VEA: Straddling 52-Week Highs
Stockcharts.com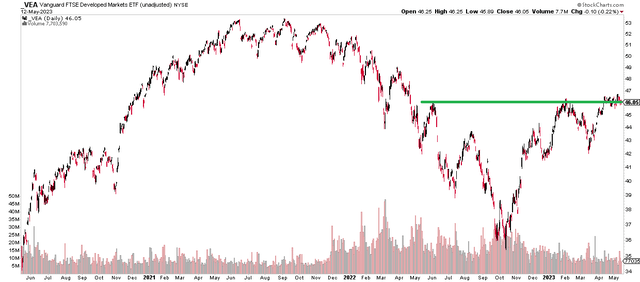
For background, VEA seeks to track the investment performance of the FTSE Developed All Cap ex US Index, according to Vanguard. The ETF provides a convenient way to match the performance of a diversified group of stocks of large-, mid-, and small-cap companies located in Canada and the major markets of Europe and the Pacific region. VEA follows a passively managed full-replication approach.
I am not myopically fixated on the technicals, either. I continue to assert that VEA is a solid long-term value. Just take a look at its P/E ratio, which is only 13.0 even after the strong rally after the Q4 2022 nadir. What’s more, earnings revisions for EAFE (which is very close to what VEA tracks) have been trending higher so far this year.
MSCI EAFE EPS Estimates Buck the Broader Trend
FactSet, Matthew Miskin, CFA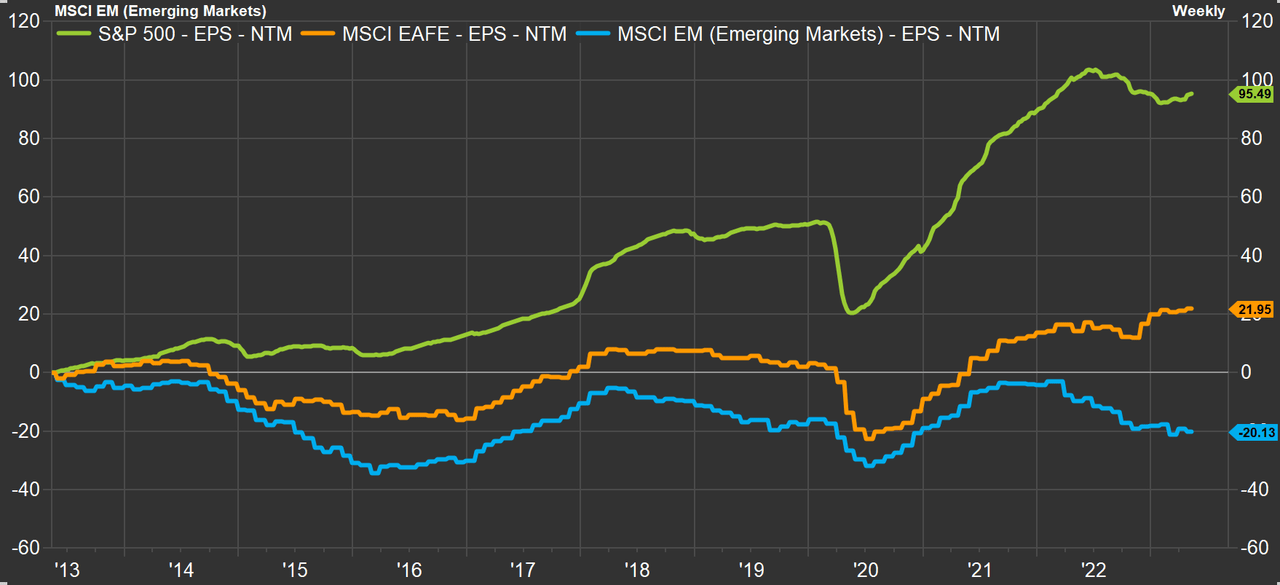
With an appealing chart, favorable valuation, and improving EPS estimates, VEA is also a solid long-term holding for investors’ non-US equity exposure (ex-EM). The fund has a low 5 basis-point expense ratio, while its 30-day median bid/ask spread is just 0.02%. The 50-day average trading volume is high at more than 10 million shares. The fund is a 4-star silver-rated product, according to Morningstar. Its dividend yield is 2.8% over the last year – a full percentage point above the S&P 500’s trailing 12-month dividend rate. Finally, Seeking Alpha has rated the ETF with A- or better ratings on momentum, expenses, risk, and liquidity.
Part of the reason VEA has produced alpha lately has been its 20% position in the Japanese stock market. Japan stocks, both big and small, have done quietly well on the year.
VEA: Strong Returns in Japan Lately Have Been Lifting the Fund
Vanguard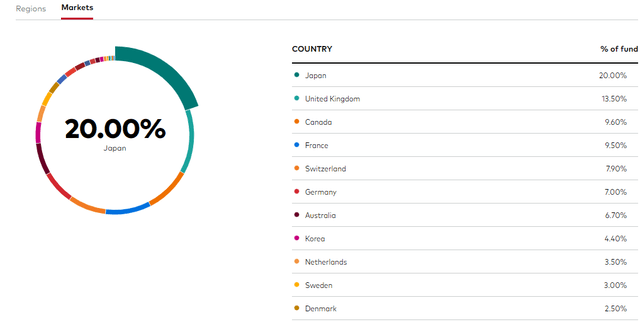
VEA: Portfolio Characteristics Per Morningstar
Morningstar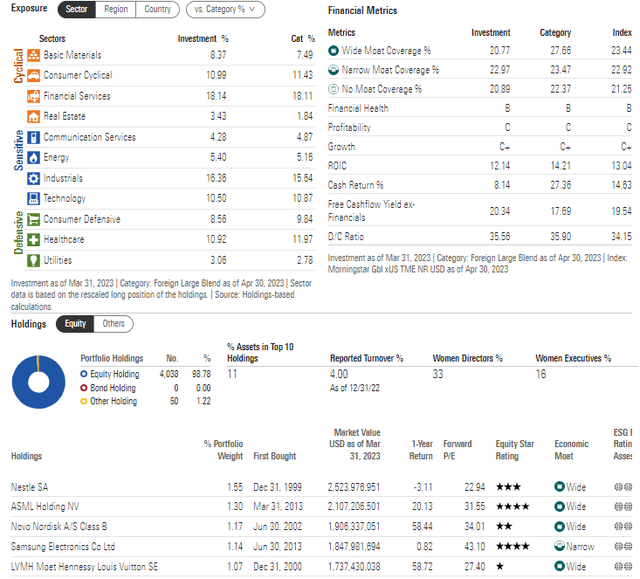
The Bottom Line
I am upgrading VEA to a buy. Price action has been solid, and the valuation and earnings pictures together are more favorable today compared to a few months ago.
Read the full article here

