
The VictoryShares US EQ Income Enhanced Volatility Weighted ETF (NASDAQ:CDC) is a fascinating financial product that might interest income investors.
During bull markets, CDC is fully invested in relatively high-yielding dividend stocks with positive earnings over the last 12 months, weighted from lower volatility to higher volatility. But during significant market declines, the fund automatically sells stocks and reallocates the capital to short-term Treasuries or cash equivalents.
I find this strategy interesting because, in theory, going heavily and systematically (taking emotion out of it) into cash during market downturns could significantly limit downside when stock prices are dropping. On the other hand, the strategy could also limit gains in the early stages of a market rally if it lingers in cash for too long.
More importantly to dividend growth investors, how does this strategy affect income generation and dividend growth over time and across market cycles?
I want to explore this below. But instead of looking at CDC in a vacuum, I will compare it to the extraordinarily well-designed US dividend growth ETF, the Schwab U.S. Dividend Equity ETF (SCHD). I think SCHD Is A Dividend Growth Investor’s Dream ETF, so in my opinion there couldn’t be a better long-only, stock-only dividend ETF for comparison’s sake.
How CDC’s Allocation Strategy Works
The index selection criteria are pretty simple and straightforward.
- Must be a US stock
- Must have positive earnings over the last 12 months
- Must have $3 million average daily trading volume
- The index filters the 500 lowest volatility stocks in the Nasdaq Global Index that fit the above criteria
- Of that 500, the index picks the 100 highest yielding stocks, weighted by volatility
- No sector can make up more than 25% of the index
But that only explains what CDC invests in on the equity/stock side. The fund is not always 100% in equities. So, what is the formula for determining when it will be fully invested in stocks versus split between stocks and cash?
Here’s an illustration from the ETF advisor, VictoryShares:
VictoryShares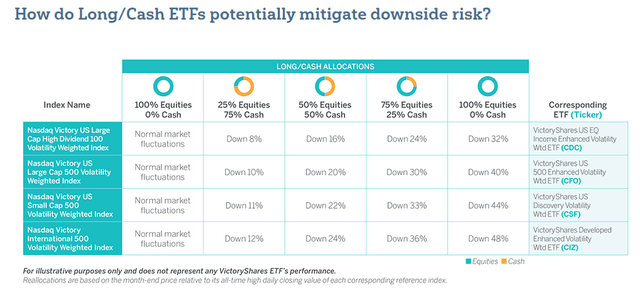
CDC’s criteria are the top row.
Rather than slowly selling stocks as the market declines, CDC’s formula is to convert 75% of the portfolio from stocks into cash after an 8% drop in the market. This creates a huge cash cushion to dramatically minimize further downside if the market falls further.
If the market does drop further, the fund switches 25% of its assets from cash back into stocks when the market is down 16%. Then, if the market goes down 24%, another 25% of assets switches from cash to stocks. Finally, if the market drops 32%, the last 25% of CDC’s cash gets invested into stocks.
It’s an automatic dip-buying strategy.
What is unclear to me is exactly how and when CDC goes back to 100% cash if the market drops less than 32% before it rebounds into a new bull market. Many pundits have proclaimed that the stock market has entered a new bull market, and yet CDC remains ~75% invested in cash.
Comparing Dividend Stock Portfolios
Let’s look at some high-level fund characteristics between these two ETFs.
| CDC | SCHD | |
| Holdings | 100 | 104 |
| P/E Ratio | 13.2x | 13.9x |
| 30-Day SEC Yield | 3.95% | 3.58% |
| Distribution Schedule | Monthly | Quarterly |
| Expense Ratio | 0.35% | 0.06% |
As you can see, the size of the portfolios (in number of holdings) is similar. So are the average P/E valuation and dividend yields. The ETFs do diverge in expense ratios, as CDC’s 0.35% reflects its more active strategy while SCHD’s ultra-low 0.06% reflects its passive nature.
When it comes to sector weightings, CDC’s preference for low-volatility stocks is strikingly obvious with its heavy weighting in utilities, certain types of financials, and consumer staples and healthcare companies.
| CDC | SCHD | |
| Utilities | 24.5% | 0.3% |
| Financials | 17.5% | 14.1% |
| Consumer Staples | 12.8% | 13.3% |
| Healthcare | 10.2% | 16.3% |
| Energy | 8.5% | 9.3% |
| Technology | 8.1% | 12.5% |
| Communications | 5.0% | 4.9% |
| Industrials | 4.6% | 17.8% |
| Consumer Discretionary | 4.5% | 8.1% |
| Materials | 4.1% | 3.4% |
In contrast, SCHD’s stock-picking methodology preferences certain quality factors like return on equity and low leverage, which generally results in relatively low-volatility holdings without specifically preferencing them.
Notably, SCHD has significantly higher weightings in industrials and technology.
Turning to the top 10 holdings, the most striking thing to note about CDC is that it remains 75% allocated to cash right now, even after the stock market crossed above the 20% threshold to technically begin a new bull market.
CDC Top Ten Holdings:
VictoryShares CDC Website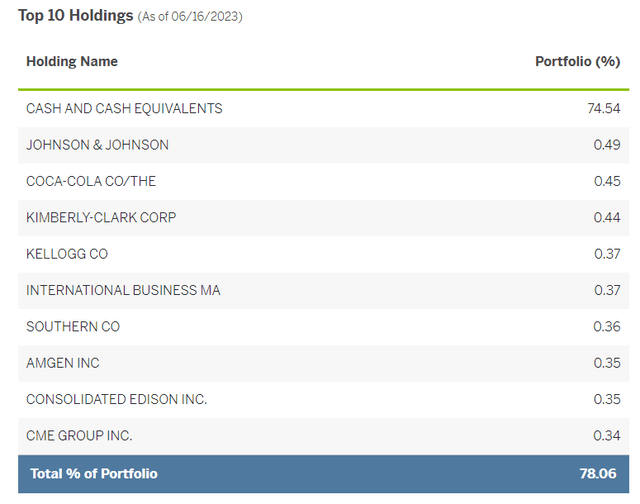
SCHD Top Ten Holdings:
Schwab SCHD Website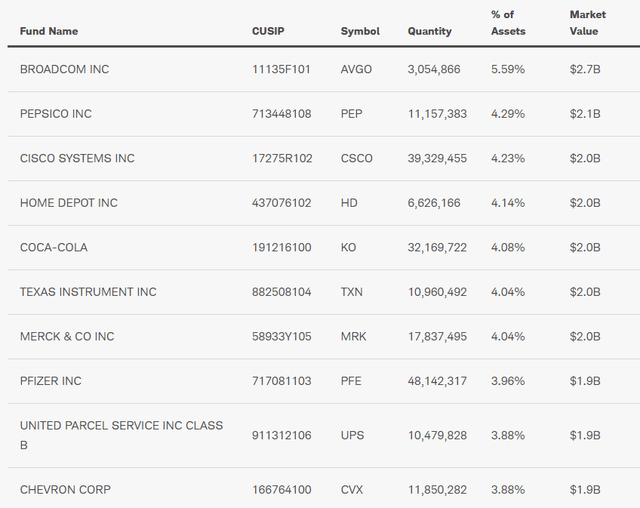
Now, if something in the economy breaks and triggers another dramatic stock selloff, then CDC shareholders will be happy about that 75% cash position. But if this truly is the start of a new bull market, then CDC will be behind the curve, having missed the early advance.
Interestingly, during the bull market from 2014 to mid-2018, CDC’s low-volatility strategy actually outperformed SCHD.
It was only after the late 2018 selloff, which triggered CDC to partially shift into cash, that CDC began to underperform SCHD.
The point here is that CDC’s stock-picking methodology does seem to work well during bull markets.
But the question is how well CDC works over the full market cycle, including crashes and bear markets. Let’s take a look at that now.
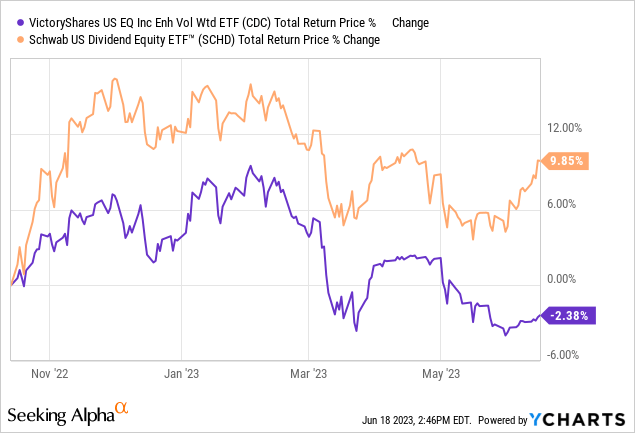
Total Returns Vs. SCHD
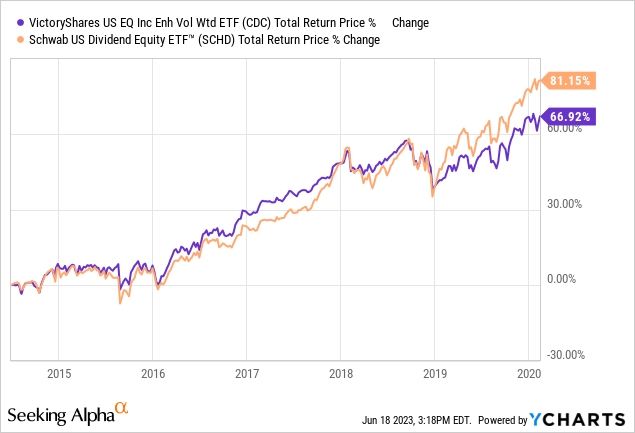
Comparing CDC’s total returns over time to those of SCHD highlights the differences between the two.
Since CDC’s inception in July 2014, the ETF’s total returns have actually been remarkably similar to SCHD’s…
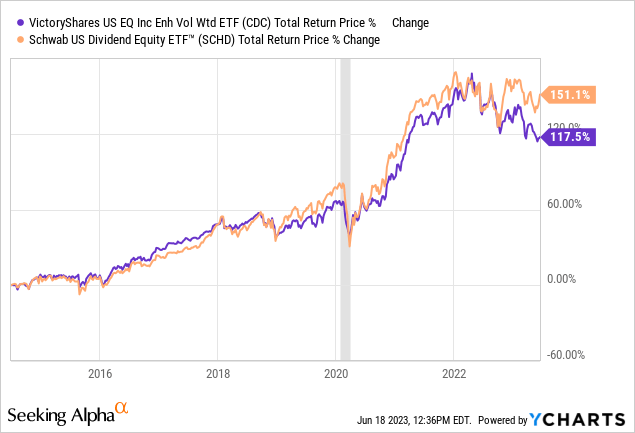
…at least until the last year or so, when the two have dramatically diverged.
Backing up a bit, though, let’s break down CDC’s performance in stages.
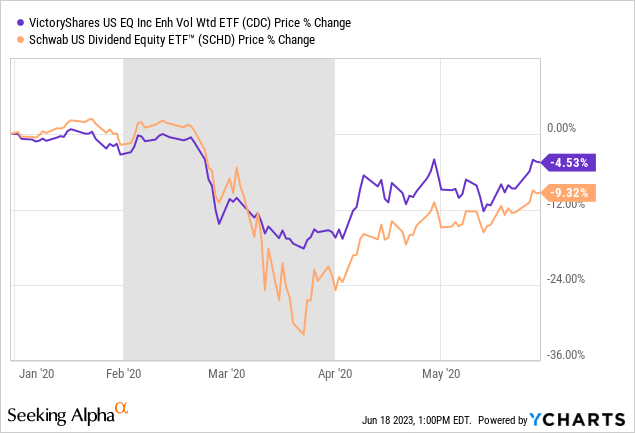
During the quick, sharp stock selloff during the initial stages of the COVID-19 pandemic, CDC at first suffered a similar drawdown as SCHD. But then, after surpassing an 8% decline, CDC went 75% into cash, thereby limiting further downside.
By design, then, it seems that CDC is skeptical of new bull markets and only buys in after the initial advance proves sustainable.
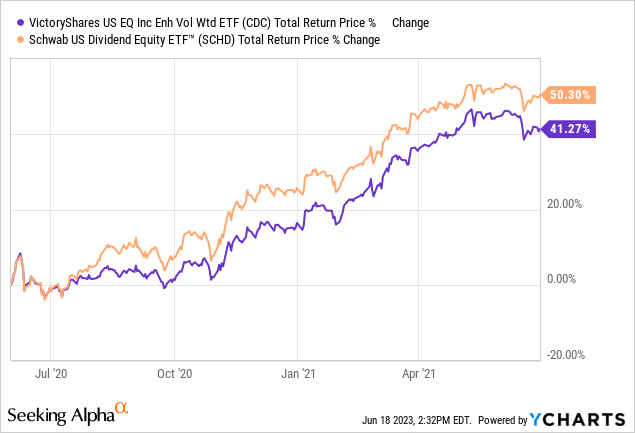
But CDC remained partially in cash coming out of the pandemic, so it partially missed the initial stage of the market rebound after the brief market meltdown in March 2020. As such, CDC’s performance lagged SCHD’s in the second half of 2020 and throughout 2021.
At the end of 2021, though, the bull market ended, giving way to the 2022-2023 bear market amid rapidly rising interest rates. Until the market bottomed in October 2022, CDC outperformed SCHD because of its cash component.
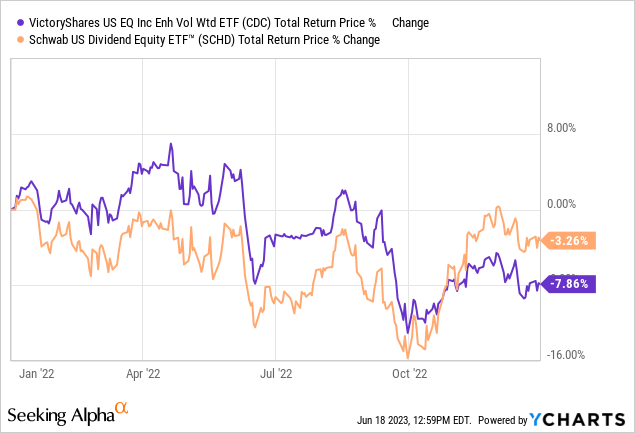
But beginning in mid-October, as the market has steadily rebounded with higher highs and higher lows, CDC has significantly underperformed.
This is, of course, to be expected to some degree. Cash provides downside protection and dry powder, but it also leads to underperformance when stock prices are rising.
If the bull market persists, however, then CDC should soon go back to 100% stocks, thereby bringing future performance more in line with SCHD’s.
For long-term buy-and-hold investors who don’t wish to trade in and out of their ETF holdings, which is better for long-term performance: downside protection or upside maximization?
The experience of the last year would suggest that “upside maximization” should be investors’ choice. But perhaps in the case of a more traditional market crash that doesn’t immediately rebound back into a bull market (unlike the 2020 COVID-19 experience), CDC would be the better choice.
Dividend Growth
The interesting thing about CDC during the current interest rate hiking cycle-induced bear market is that switching to cash equivalents has not meant giving up income. Instead, cash equivalents have offered higher and higher yields as the Fed has raised rates, pushing the short end of the yield curve up. Thus, CDC probably sold stocks yielding 3-4% and exchanged them for cash equivalent funds yielding roughly the same. Today, though, those cash equivalent funds yield closer to 5%.
If stocks sell off because of a rate-hiking cycle, CDC shouldn’t necessarily see its income drop. That has been the case over the last year and a half.
While SCHD’s simpler strategy has generated larger dividend growth since mid-2014, CDC’s dividend growth has been quite respectable as well.
| Dividends | CDC | SCHD |
| Mid-2014 to Mid-2015 | $0.95 | $1.07 |
| Last 12 Months | $2.19 | $2.64 |
| Dividend Growth | 131% | 147% |
In fact, looking at CDC’s monthly dividend history, I would not have been able to tell when it switched from stocks to cash equivalents and back. Again, though, this is probably because of just how high cash equivalent yields have gotten over the last year.
Bottom Line
CDC is a very intriguing choice for dividend growth investors and income investors seeking some degree of downside protection during market crashes and selloffs.
The question investors must ask themselves is whether underperformance coming out of downturns (and potentially over the long run) is worth the comfort of downside protection during those rare, sharp stock selloffs. Another question is whether CDC’s strategy breaks during long-running bear markets like the one we’ve been in over the past year or so.
Of course, investors will naturally wonder why they can’t simply perform CDC’s strategy themselves by shifting to cash at certain points. But the point of using CDC is that it takes all emotion and subjectivity out of that decision to go to cash. No matter how emotionless and robotic an investor believes themselves to be, the risk of making an emotion-driven mistake during a market panic shouldn’t be ignored.
Then again, the formulaic approach taken by CDC also strips out the fundamentals. If an investor has a strong view that the fundamentals are positioning stocks for a rebound, or that an ongoing stock rebound is justified, CDC’s cash position may be more of a burden than protection.
I am intrigued by CDC and will continue to watch it, but I am not compelled enough to buy it at this time.
Read the full article here

