
The residental construction industry has recently put in an impressive performance. The Dow Jones US Home Construction Index rose by approximately 64.52% YTD. The largest stock by market capitalization in this index is D.R. Horton (NYSE:DHI), a U.S. company that is specialized in the marketing and sale of single-family homes, multi-family homes and housing development. In addition, they offer real estate financing options. A neglected small portion of their business is rentals. In July 2022 to June 2023, they completed 83,201 homes. The stock’s performance YTD was about 72.30%, much better compared to the index, and outstanding compared to the Dow Jones (7.52% YTD).
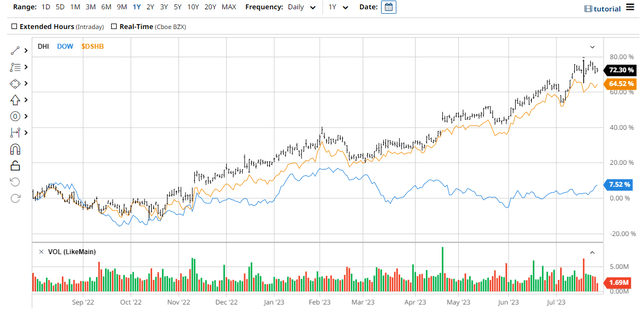
Comparison of D.R. Horton stock with the Dow Jones and the U.S. Home Construction Index. (Barchart)
To shed some light on what particularly has given D.R. Horton such strong growth and how it affects their corporate metrics, I’ll first start with a summary of what I consider to be the most important metrics.
What do the key numbers look like?
The following is a brief overview of the key figures used in the analysis, with a particular focus on the development of these figures. The numbers come from the annual reports of D.R. Horton.
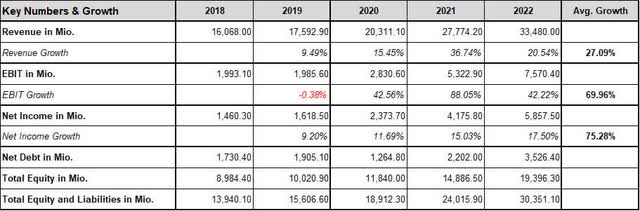
D.R. Horton’s Key Numbers And Growth Rates. (Author)
Exorbitant growth in both sales (27% p.a.) and net income (70% p.a.) can be seen, resulting primarily from the last two years. To be able to understand the growth more precisely, I have created a diagram with historical values. This makes it easier to classify the growth rates in terms of consistency.
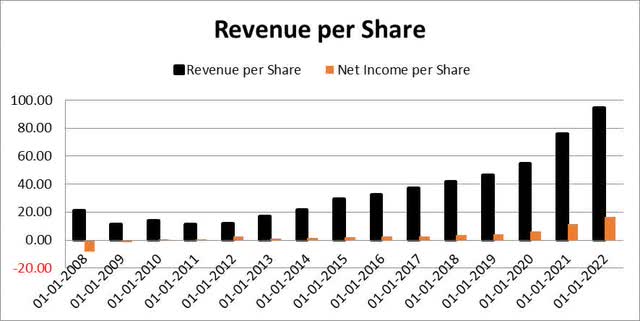
Historical numbers for revenue per share and net income per share. (Author)
The chart shows the figures for revenue and net income per share going back to 2008. The figures from 2008 and 2009 show the loss-making years during the financial crisis. In general, relatively constant growth in revenue could be observed up to the year 2020. Profit also followed a relatively constant trend. There are no outliers to be seen, as was most recently the case in 2021 and 2022, in which significantly higher growth rates were achieved, as already mentioned. In D.R. Horton’s annual report, these growth rates are explained by a strong increase in demand in connection with a turnaround in interest rate policy. This also sounds plausible, as many people who may not have been in a hurry to buy a home before certainly saw this as the last chance to secure cheap money at low interest rates.
In the next step, I would like to continue with the consideration of profitability.
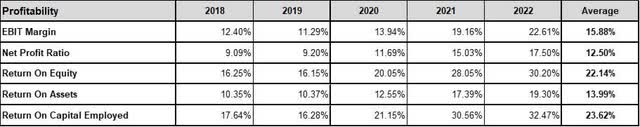
D.R. Horton’s Profitability Metrics. (Author)
A look at the profitability shows that margins have also improved significantly. This is mainly due to the strong last two years. It is very questionable whether such gains will be repeated. The fact that the company operates in the cyclical homebuilder market means that the balance sheet, which looks so strong so far, can be attributed to the fact that the industry cycle is in a peak phase, after sifting through the growth and profitability figures. The question is how long this peak phase will last and what will happen when the demand is no longer there.
Finally, we take a brief look at the key risk indicators.
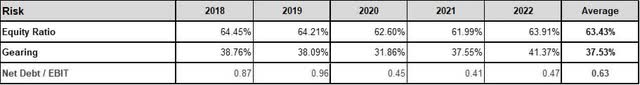
D.R. Horton’s Risk Metrics. (Author)
The key metrics for risk assessment all show very solid values. Gearing has increased slightly to 41.37% in recent years and averaged 37.53%. The equity ratio is very stable and averages 37.53% over the last five years. The ratio of net debt to EBIT is also in order at an average of 0.63, but the trend is downward. I think D.R. Horton can therefore be assigned a rather low risk, in the current financial situation.
Possible valuation of D.R. Horton
The assumption of disproportionately high growth rates is underlined by the extremely low valuation ratios:
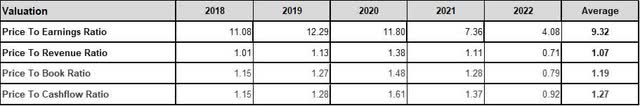
D.R. Hortons Evaluation Multipliers. (Author)
On paper, D. R. Horton looks undervalued, but this means nothing other than that the market does not expect the 2022 earnings to be sustained in the future. Historically, more constant multiples can be perceived:
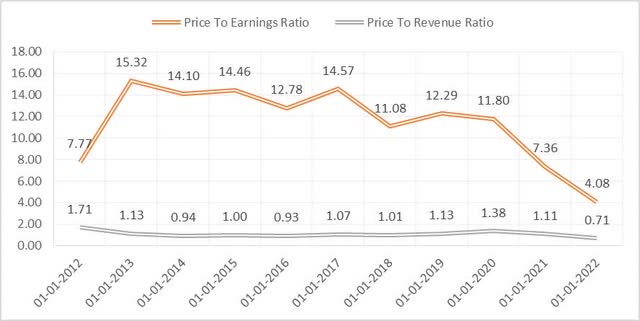
Development of the P/E ratio and P/R ratio of D.R. Horton over the last 10 years. (Author)
Both P/E ratio and P/R ratio show a downward trend. However, this can be seen better in the P/E ratio in the present figure. Looking at the years 2013 to 2020, an average P/E ratio of between 12 and 13 can be observed. To be a bit more conservative with the current numbers, I would use a P/E ratio of 12 to calculate the Net Income fair based on the current valuation. At a share price of about $126, this would result in a net income of $3.725 billion. This is a good discount to the net income of $5.857 billion achieved in 2022, but also a big premium to the net income of $2.373 billion still achieved in 2020.
But what do analysts estimate in the medium term?
In the following chart, analysts’ estimates of 12 analysts for D.R. Horton over the last several years are compared to the actual net income generated. In 2023, only the first two quarters are included so far.
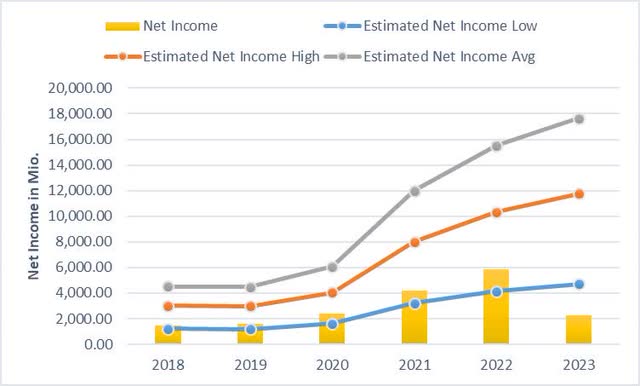
Estimated net income versus actual net income. (Author)
It is noticeable that the analysts have always estimated too well on average and the conservative estimates have only been slightly exceeded. If this trend continues, in 2023 it could be a little over $4,704 billion, more than the current valuation suggests. However, the price not only reflects the short-term future but also the long-term one. So, over the longer term, the market seems concerned about the continuity of these gains.
All in all, I would like to show with my reflections that the company is very difficult currently to evaluate. It looks very cheap, particularly across the multiples, but it harbors macroeconomic risks. The current valuation is shaped by these macroeconomic assumptions, which makes any long-term valuation very difficult.
Risks that could affect the stock in the medium term
As mentioned above, the homebuilder industry is a cyclical industry. The industry is influenced, for example, by unemployment rates, demographics, inflation and interest rates. Especially interest rates and inflation have been fluctuating recently, which can cause changes in the demand for houses in the medium term. Inflation reduces the financial strength of potential buyers by requiring more money for living expenses. Higher interest rates make it harder to borrow money because the interest burden can become too high. While D. R. Horton offers homes in price ranges between $200,000 and $1,000,000 and buyers could move to lower price segments, I think that is unlikely. There is always an emotional aspect to buying a home, so buyers might be willing to wait a little longer to buy. This would inevitably lead to a loss of sales. In addition, prospects for housing starts have become increasingly pessimistic in recent months.
Conclusion
All in all, DR Horton has had an outstanding performance in recent months and years. This was achieved not through speculation but through actual profits generated. As a result, the financials looks very good. In the cyclical homebuilder market, macroeconomic conditions have recently encouraged very positive developments. In my opinion, there is a non-negligible risk of a turnaround in these circumstances. While the valuation is low with the current numbers, I am not convinced that profits will be consistent over the next few years. In general, the macroeconomic influence makes valuation very difficult. I think much of the return has already been made in the last few years. Since I cannot come to a clear buy decision and see the stock rather at the peak of its cycle right now, I will not invest for now. Nevertheless, the story of D.R. Horton since the financial crisis 2008 speaks for itself and the performance shows that it is an excellent company.
Read the full article here

