
A recent Odd Lots podcast with Bill Gross reminded me of my personal hobby of reviewing investment funds ‘managed’ by the famous investor, Jeff Gundlach. To be honest, having reviewed at 4 or 5 Doubleline funds in the past few months, I am quite disappointed by what I see. The Doubleline Opportunistic Credit Fund (NYSE:DBL) is no exception.
In my opinion, the DBL fund is a poorly performing credit fund that pays much more than it earns. This leads to rising risk of distribution cuts over time. I recommend investors avoid the DBL fund.
Fund Overview
The Doubleline Opportunistic Credit Fund is a closed-end fund (“CEF”) that seeks to deliver a high level of current income from opportunistically investing in various credit sectors.
The DBL fund is lead managed by Doubleline’s Fixed Income Asset Allocation (“FIAA”) committee, led by the famous fixed income investor, Jeff Gundlach. The committee looks at the relative value and potential risks across the fixed income universe, combining top down sector allocation with bottom up fundamental research and analysis (Figure 1).
Figure 1 – DBL investment process (doubleline.com)
DBL’s open-ended mandate allows the fund to invest in various kinds of fixed income securities including mortgage-backed securities (“MBS”), asset-backed securities (“ABS”), treasuries, corporate bonds, international sovereign bonds, and short-term investments. Essentially, the DBL fund is an unrestricted fixed income hedge fund that in theory incorporates the best of Doubleline’s investment ideas.
As of August 31, 2023, the DBL fund had $240 million in net assets and $280 million in gross assets for 15% effective leverage (Figure 2).
Figure 2 – DBL overview (doubleline.com)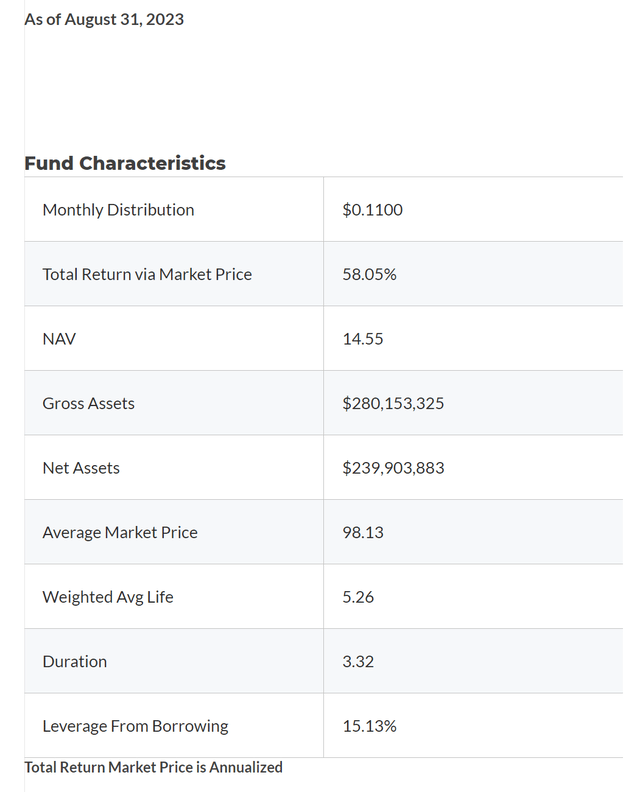
The DBL fund charged a hefty 2.46% annualized net expense ratio in the half year to March 31, 2023. Net expenses have been rising in the past few years due to rising interest expense.
Portfolio Holdings
Figure 3 shows DBL’s sector allocation as of August 31, 2023. The fund’s largest allocation is CLOs at 32.3%, followed by non-agency CMBS at 18.7% and agency RMBS at 16.9%. Non-agency RMBS was 13.6% of the portfolio while Bank Loans were 9.0% of the portfolio.
Figure 3 – DBL asset allocation (doubleline.com)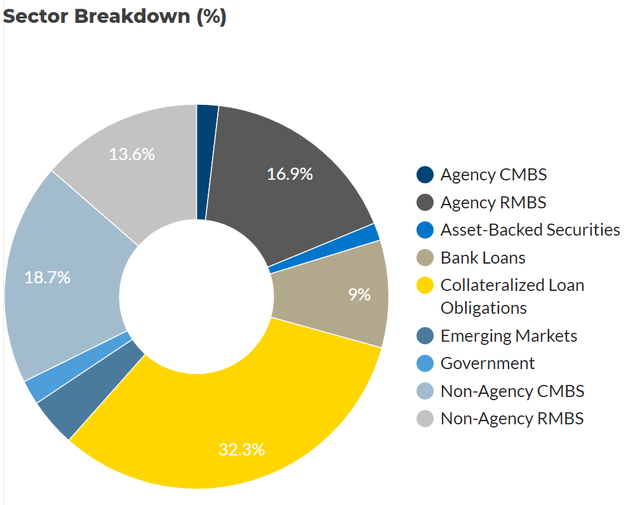
Despite the fund claiming to be opportunistic, DBL actually has a relatively low turnover ratio of 7% in the half year to March 31, 2023 and 25% in the fiscal year ended September 2022.
Figure 4 shows the fund’s credit quality allocation. 37.9% of the assets are rated non-investment grade, 30.0% is rated investment grade, 15.6% is government securities, and 12.2% is unrated.
Figure 4 – DBL credit quality allocation (doubleline.com)
The DBL fund has a relatively modest portfolio duration of 3.3 years (Figure 2 above) with Figure 5 showing the fund’s duration exposure. Approximately 2/3 of the fund or 66.8% is concentrated in 0-3 year duration, 5.9% of assets is 3-5 year duration, 5.6% is 5-10 year duration, and 5.7% is greater than 15 year duration.
Figure 5 – DBL duration allocation (doubleline.com)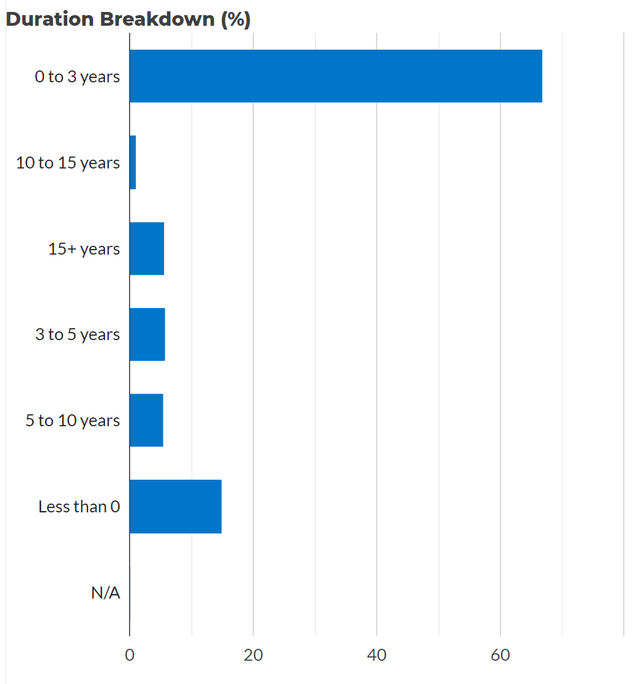
Returns
Figure 6 shows the historical returns of the DBL fund. Overall, DBL’s historical performance has been poor, with 3/5/10Yr average annual returns of -1.7%/1.0%/4.3% respectively to August 31, 2023. The 3 and 5 year figures are considered 4th quartile, while the 10yr figure is 3rd quartile compared to the Multisector Bond category in Morningstar.
Figure 6 – DBL historical returns (morningstar.com)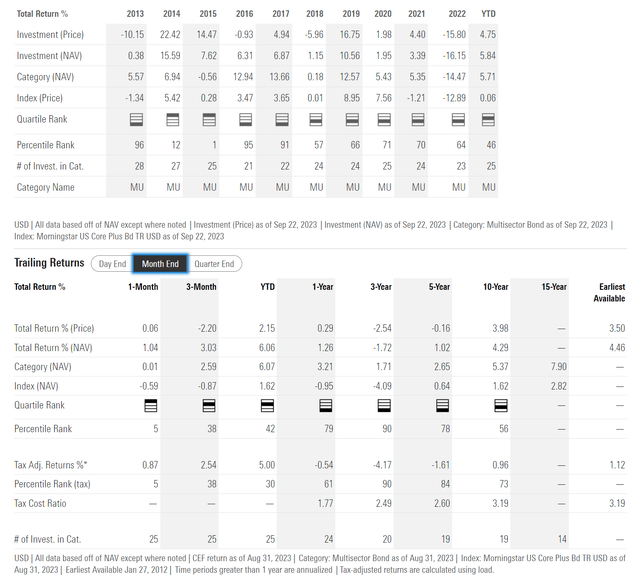
DBL’s performance was notably bad in 2022, as the DBL fund lost 16.2%, wiping out several years of modest gains. 2022 was a poor performance year for most fixed income strategies as the Federal Reserve increased interest rates aggressively to fight inflation and this caused fixed income assets to suffer MTM declines due to duration exposure. However, DBL underperformed its underlying asset classes.
For example, non-investment grade credit, as represented by the SPDR Bloomberg High Yield Bond ETF (JNK), lost 12.4% in 2022 with a portfolio duration of 3.6 years (Figure 7).
Figure 7 – JNK historical annual returns (mornignstar.com)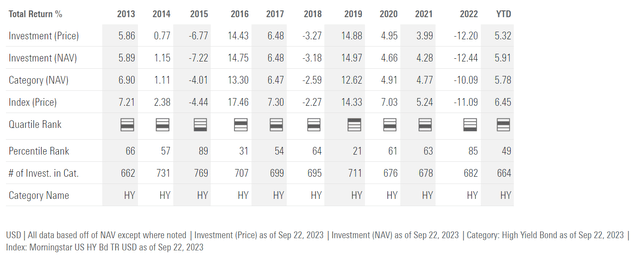
High quality AAA-rated CLO tranches, as represented by the Janus Henderson AAA CLO ETF (JAAA), returned 0.5% in 2022.
Figure 8 – JAAA historical annual returns (morningstar.com)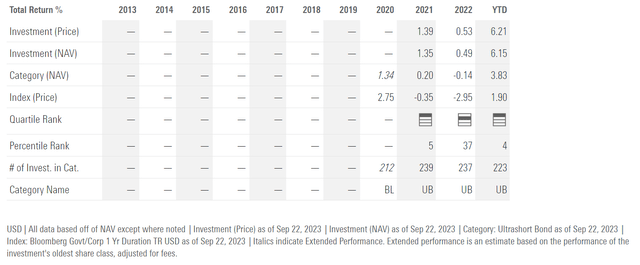
CMBS securities as represented by the iShares CMBS ETF (CMBS), with a portfolio duration of 4.2 years, lost 11.2% in 2022.
Figure 9 – CMBS historical annual returns (morningstar.com)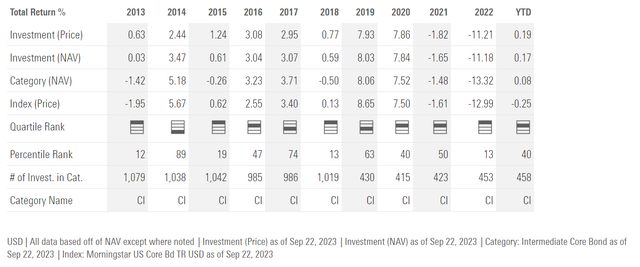
Bank loans, as represented by the Invesco Senior Loan ETF (BKLN), lost 1.7% in 2022.
Figure 10 – BKLN historical annual returns (morningstar.com)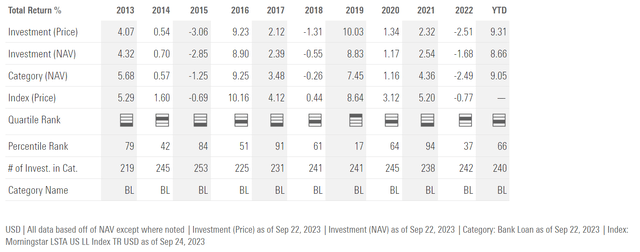
So similar to other Doubleline funds I have recently reviewed, the DBL fund appears to have underperformed its underlying asset classes, calling into question the value of Doubleline’s FIAA committee.
Distribution & Yield
Despite its modest historical total returns, the DBL fund does pay a very attractive distribution yield. The DBL fund pays a monthly distribution of $0.11 or a 9.1% forward yield on market price. On NAV, the fund is paying a 9.2% yield.
Figure 11 – DBL is paying a 9.1% forward yield (Seeking Alpha)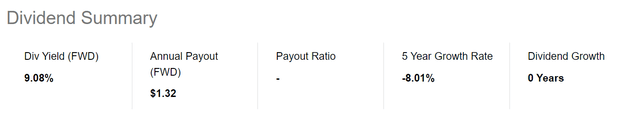
Historically, the DBL fund has not relied too heavily on ‘return of capital’ (“ROC”) to fund its distribution (Figure 12). Nonetheless, I am still concerned about the sustainability of DBL’s distribution given the wide gap between the fund’s historical total returns and its distribution yield.
Figure 12 – DBL has not relied too heavily on ROC to fund distribution (DBL semi-annual report)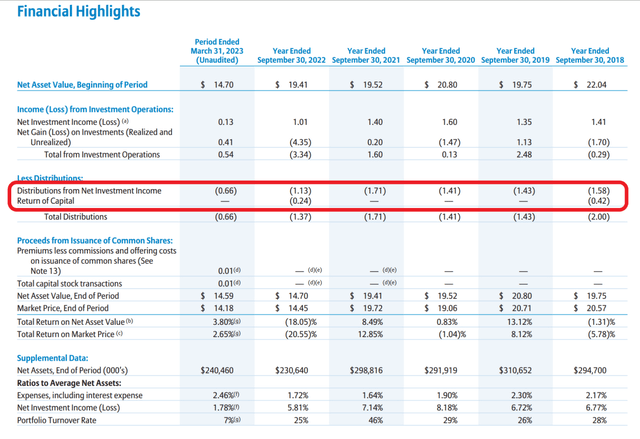
Instead of just looking at whether distributions are funded by net investment income (“NII”), investors need to go one step further and consider total returns since many investment funds can ‘game’ the NII test by buying investments that pay a high yield but suffer large realized losses.
For example, in the past 5 and a half years, the DBL fund had a cumulative realized and unrealized loss on investment of $5.78 per share, or 26.3% of beginning NAV. So even if NII has more or less been sufficient to fund distributions, investors still suffered a real loss of principal through investment markdowns.
In fact, if we compare the DBL fund’s long-term total returns of 4.3% over 10 years versus its 9.1% forward distribution yield, it becomes much clearer that the DBL fund is yet another amortizing ‘return of principal’ fund, as described in an Eaton Vance whitepaper.
‘Return of principal’ funds are characterized by long-term declines in NAV, whether it is from the fund having to liquidate assets to fund its distribution (i.e. return of capital), or stretching for yield and suffering investment losses. Figure 13 shows DBL’s long-term decline in NAV and share price.
Figure 13 – DBL has a classic declining NAV pattern that is characteristic of ‘return of principal’ funds (morningstar.com)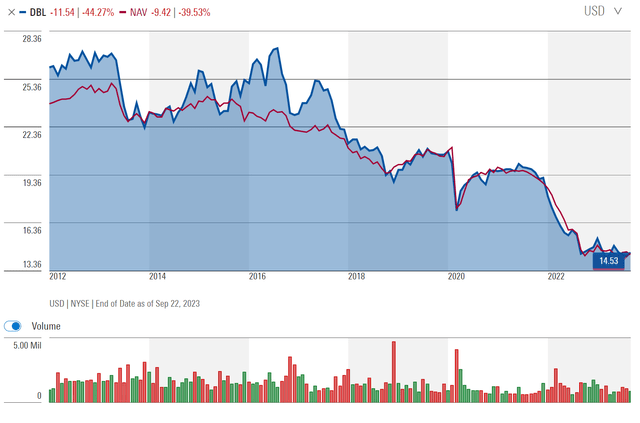
Over time, investors in ‘return of principal’ funds may see a loss of principal (as market price tracks the decline in NAV) and lowered income (as there is less assets to earn income with). Figure 14 shows the long-term decline in DBL’s annual distribution, from over $2.50 / share in 2015 to $1.32 recently.
Figure 14 – DBL’s distribution has shrunk from over $2.50 / share in 2015 to $1.32 recently. (Seeking Alpha)
Conclusion
The Doubleline Opportunistic Credit Fund is yet another poorly performing ‘return of principal’ fund offered by Doubleline. Historically, the DBL fund has delivered 3rd or 4th quartile performance compared to peer credit funds. The DBL fund notably underperformed the various fixed income asset classes in 2022, which calls into question Doubleline’s acumen.
Although the DBL fund pays an attractive 9.1% distribution yield, there is evidence that the fund may be stretching for yield and realizing investment losses that lower total returns.
Overall, I recommend investors avoid ‘return of principal’ funds because they often lead to long-term losses in both principal and income.
Read the full article here

