
By Tracy Chen, CFA, CAIA
The traditional risk parity portfolio has come under scrutiny. The classic asset allocation of 60% stocks/40% bonds is built upon the thesis that stocks and bonds when paired together can provide shock absorption to achieve attractive risk-adjusted returns. These diversification benefits rely on the historical correlation between stock and bond performance. This correlation is an important consideration for asset allocations in a multi-asset portfolio. However, this time-tested belief may not always be true.
1. Historical stock/bond correlation is not static and can be volatile. Looking at the 24-month rolling correlation between the total return of the S&P 500 Index, including dividends, and the 10-year Treasury bond, including coupons, reveals significant volatility (see Exhibit 1). The relationship has even fluctuated between significant positive and negative correlations. In statistics, the correlation coefficient is used to measure the size and direction of a relationship between variables using a scale that ranges from -1 to +1. Among 1,005 monthly observations of the S&P 500 and the 10-year Treasury bond, there are 560 positives and 445 negatives, ranging from -0.8 to +0.8. This chart suggests that the relationship between equity and fixed income performance should not be considered static or even always negative, but rather as a dynamic process that involves changes and regime shifts over time.
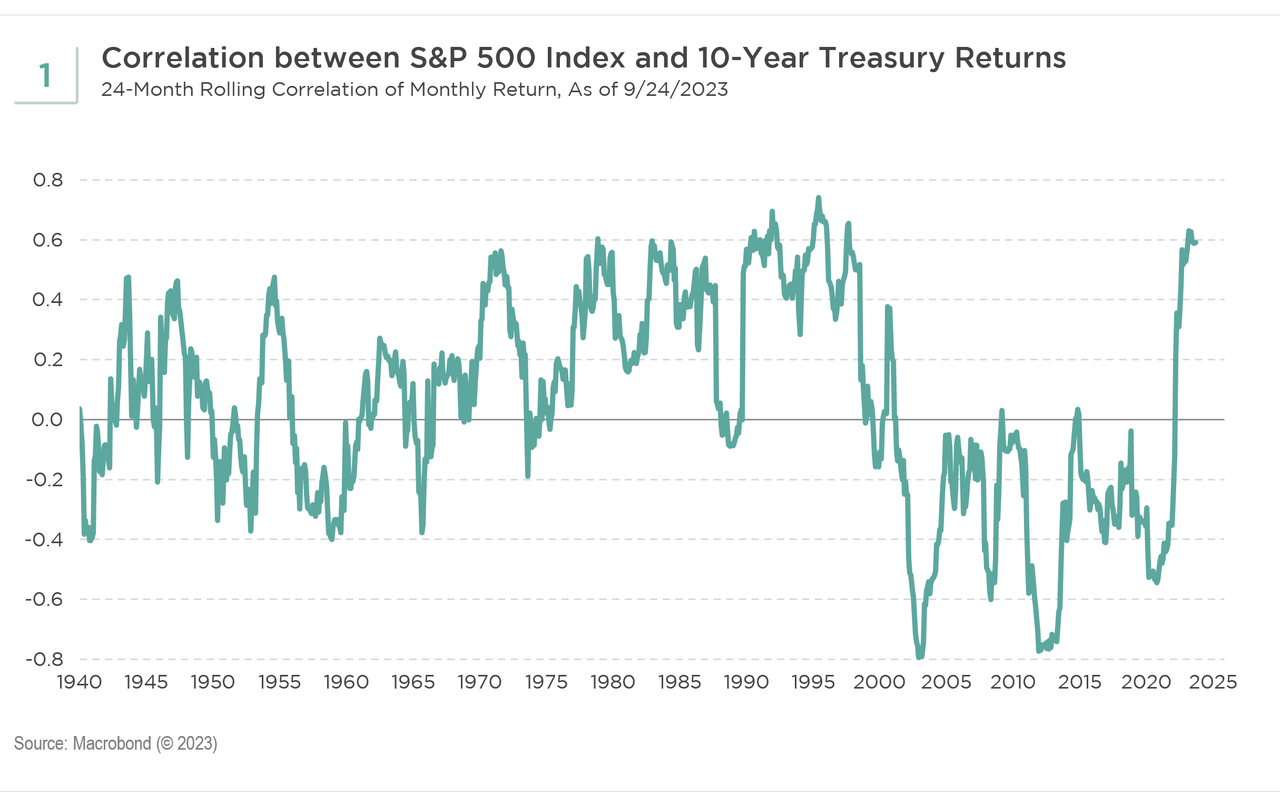
During the time periods of hyperinflation in the 1970s and moderately high inflation in the 1950s and 1990s, correlation between stocks and bonds was mostly positive for a total of almost 40 years, peaking in 1997 but remaining positive until the early 2000s. From then on, correlation turned sharply negative. The negative correlation regime that started in the 2000s lasted over 20 years until 2022. The correlation flipped sharply from negative to positive in March 2022. How long this positive correlation regime will last and how will it evolve from here are important questions to address.
2. Many factors drive stock and bond returns, also impacting correlation. The observed correlation between U.S. stocks and bonds is a function of complex interactions between many macroeconomic factors. Given a prevailing macroeconomic environment, an assessment of the relevant drivers, including inflation shocks, inflation uncertainty, tightness of monetary policies (real yield), recession shocks, market volatility, etc., is important. As investors, we need to be alert to regime shifts that affect correlation and adjust our asset allocation accordingly.
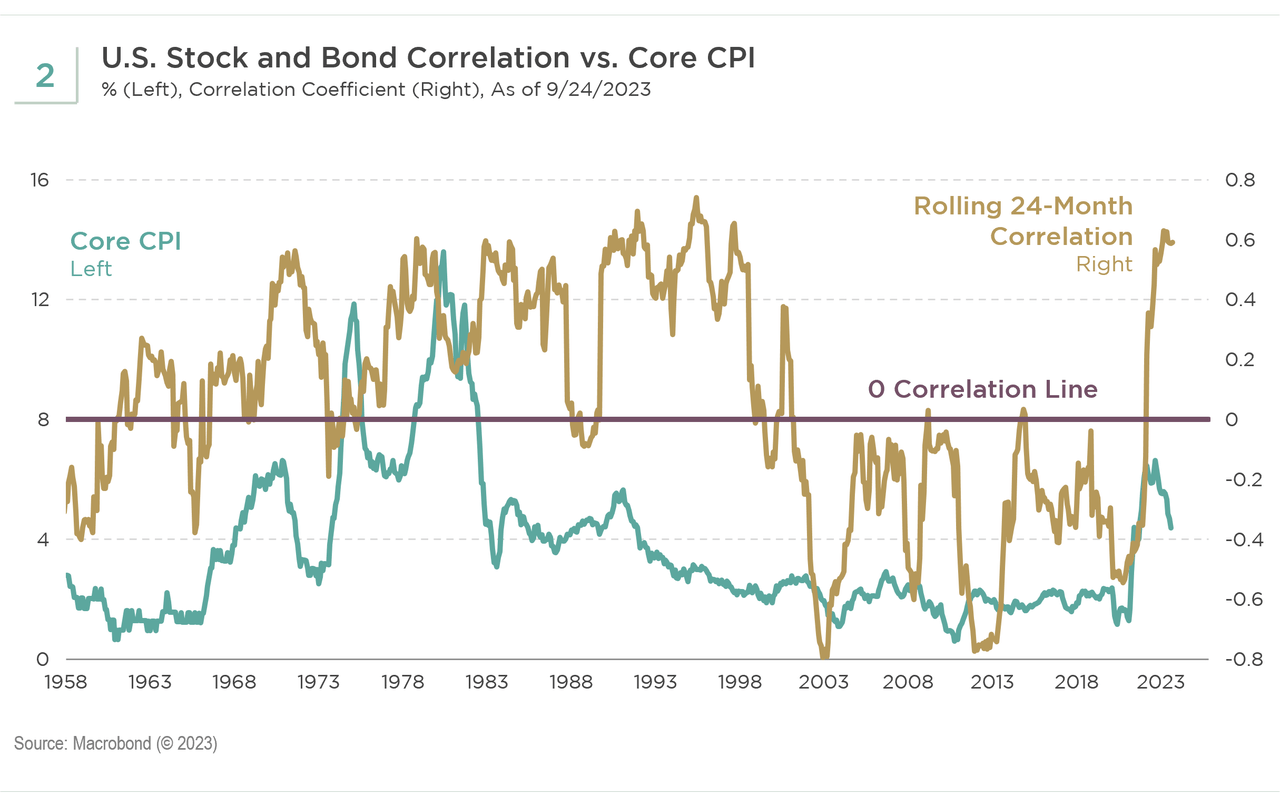
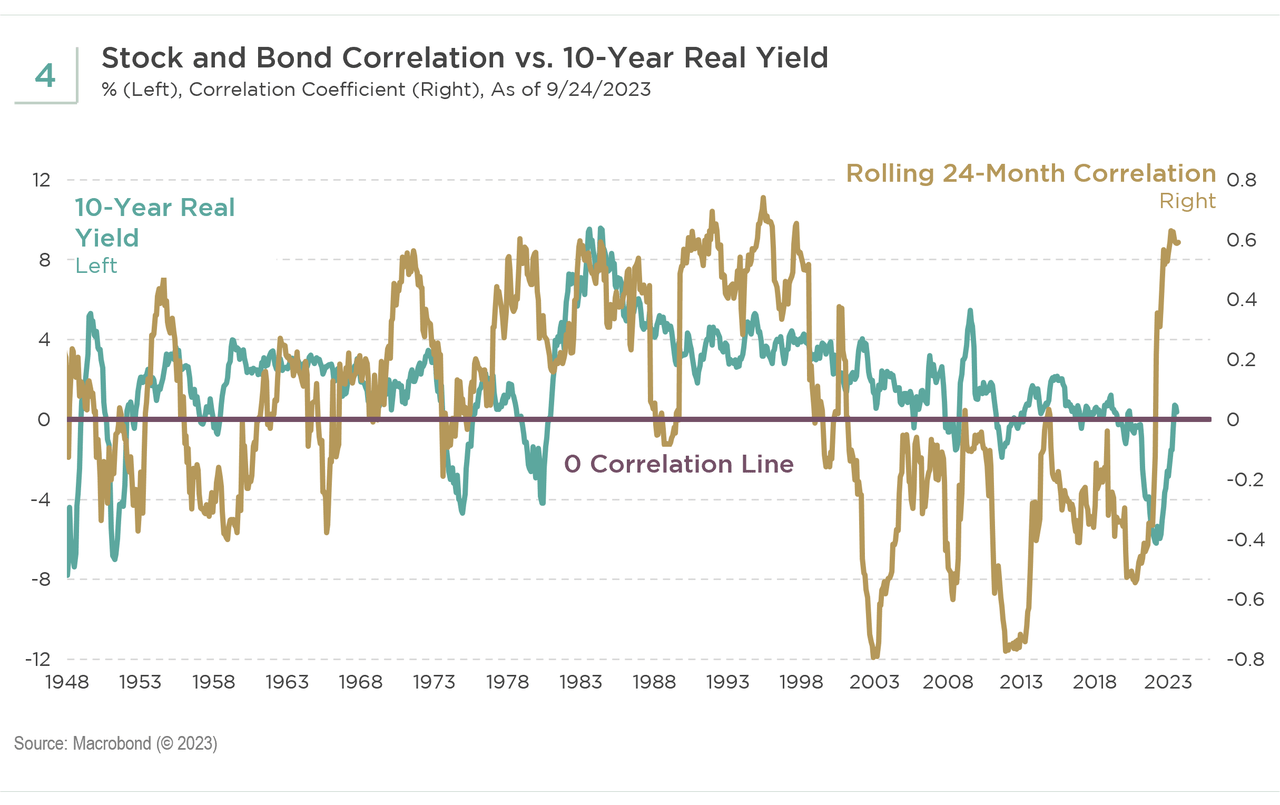
3. Two primary macroeconomic drivers help explain correlation. Overlaying two primary macroeconomic drivers, Core CPI, and 10-year real yields, with the correlation between U.S. stocks and bonds produces some important observations.
- Core CPI can help explain the very positive correlation from the 1950s through the 1990s, the negative correlations in the 2000s, and the return to positive in early 2022 (see Exhibit 2).
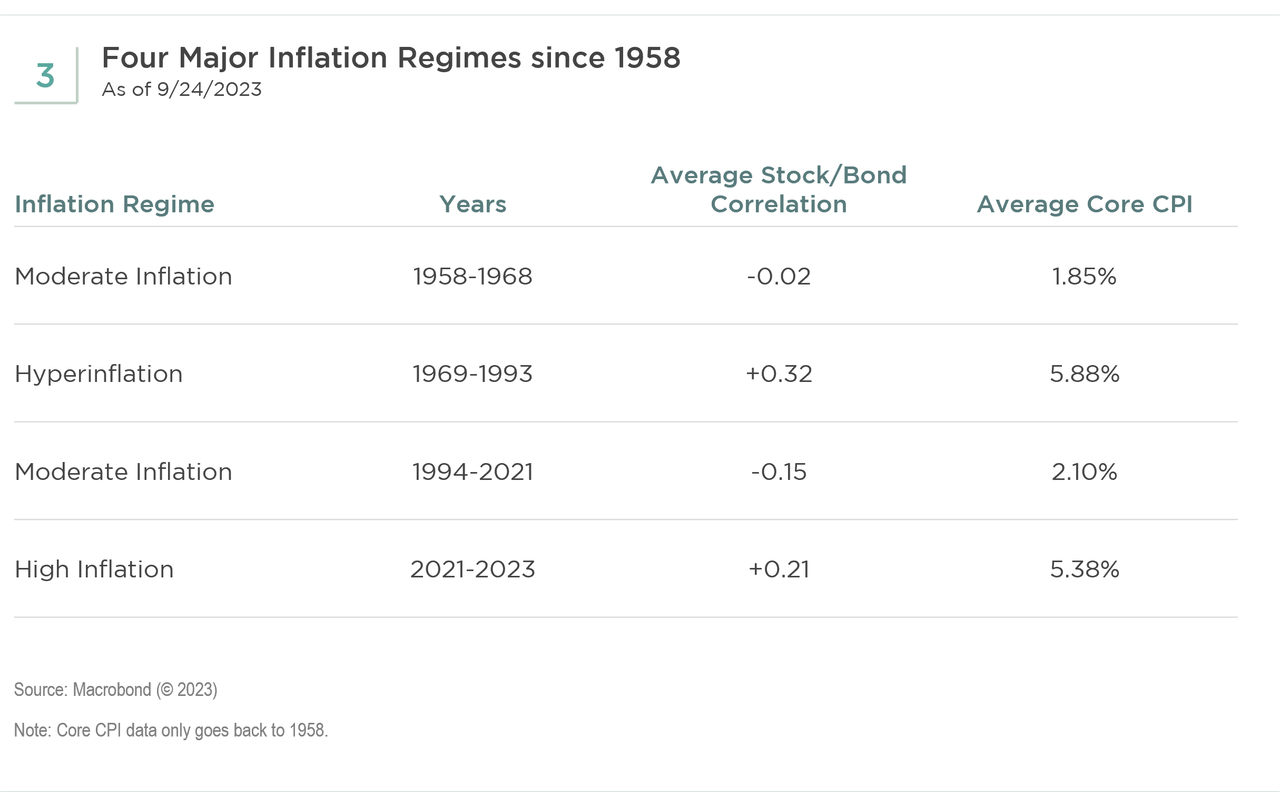
From the core CPI data, we can identify four major inflation regimes and their average inflation and stock/bond correlations, respectively (see Exhibit 3). This analysis helps illustrate patterns in correlation and inflation. During periods when inflation was moderate, correlation was flat or negative and subsequently turned positive amid hyper/higher inflation environments. The reasoning behind these trends is explained by higher inflation directly triggering higher short-term rates and bond risk premiums, hurting bonds. Meanwhile, the negative effect on equities through the higher discount rate tends to outweigh positive changes in cash flow expectations.
-
Investment Implications
The dynamic nature of the correlation between the performance of stocks and bonds suggests that a passive asset allocation approach to portfolio composition may often fall short. Instead, we believe investors need to be cognizant of the various drivers impacting this relationship. Depending on the prevailing inflationary environment, the role of bonds in multi-asset portfolios can vary. This finding especially applies to the potential effectiveness of risk hedging or the safe haven role of bonds in a higher inflation environment. Furthermore, it also suggests the heightened importance of investing in the global bond universe, which offers a larger investment universe and opportunity set for greater potential diversification efficacy in a portfolio.
Index Definitions
S&P 500 Index is a broad measure of U.S. domestic large cap stocks. The 500 stocks in this capitalization-weighted index are chosen based on industry representation, liquidity, and stability.
Core CPI is constructed on a monthly basis by the Bureau of Labor Statistics. The core CPI excludes food and energy prices from the CPI. The Consumer Price Index (CPI) is used to measure the change in the out-of-pocket expenditures of all urban households for a particular set of goods and services. In terms of its coverage, the CPI measures the cost of spending made directly by households for the items in its basket, with the notable exception that it also includes a measure of the rents that homeowners implicitly pay instead of renting their home. The CPI is constructed by the Bureau of Labor Statistics and is released around the middle of each month, with a one-month publication lag.
Original Post
Editor’s Note: The summary bullets for this article were chosen by Seeking Alpha editors.
Read the full article here

