
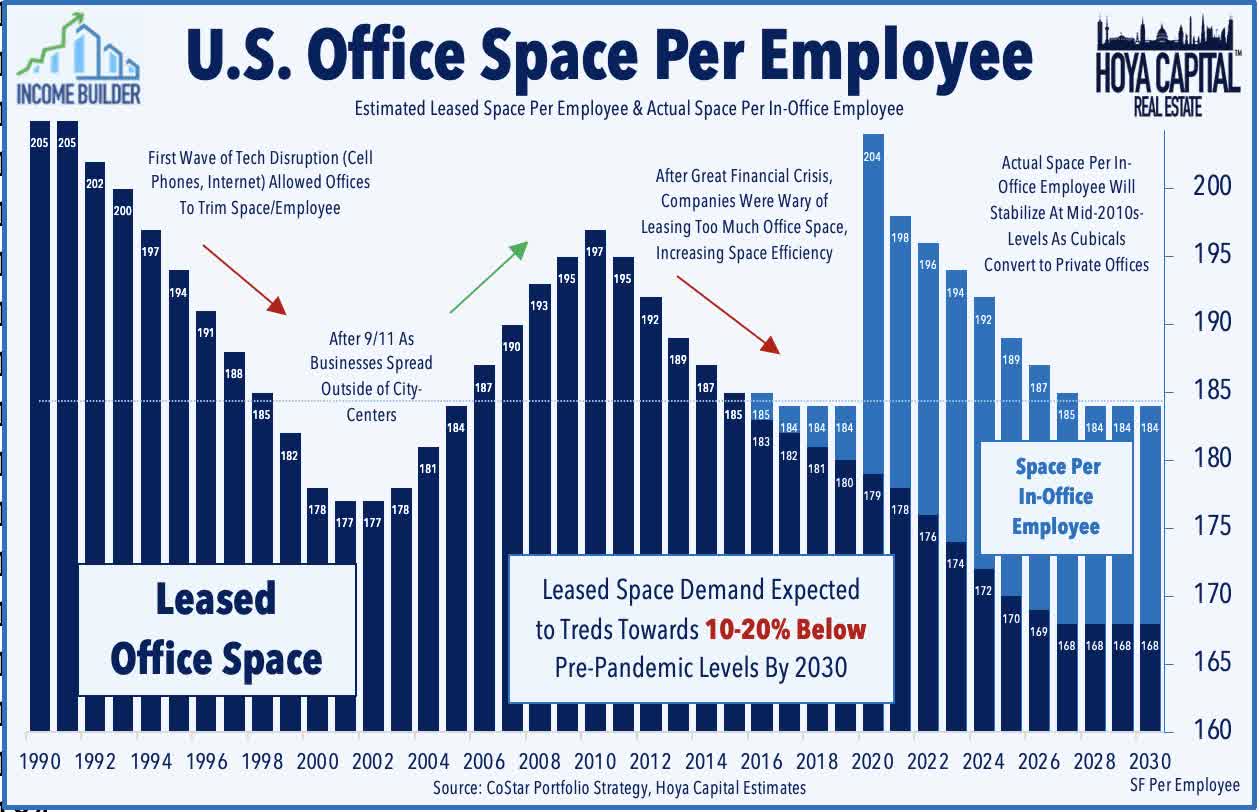
Office REITs have been hammered by the WFH (Work from home) trend that emerged from the pandemic. And that trend is here to stay, so the oversupply of office space nationwide will linger for some time, with leased office space demand expected to sink to 10-20% below pre-pandemic levels by 2030.
Hoya Capital Income Builder
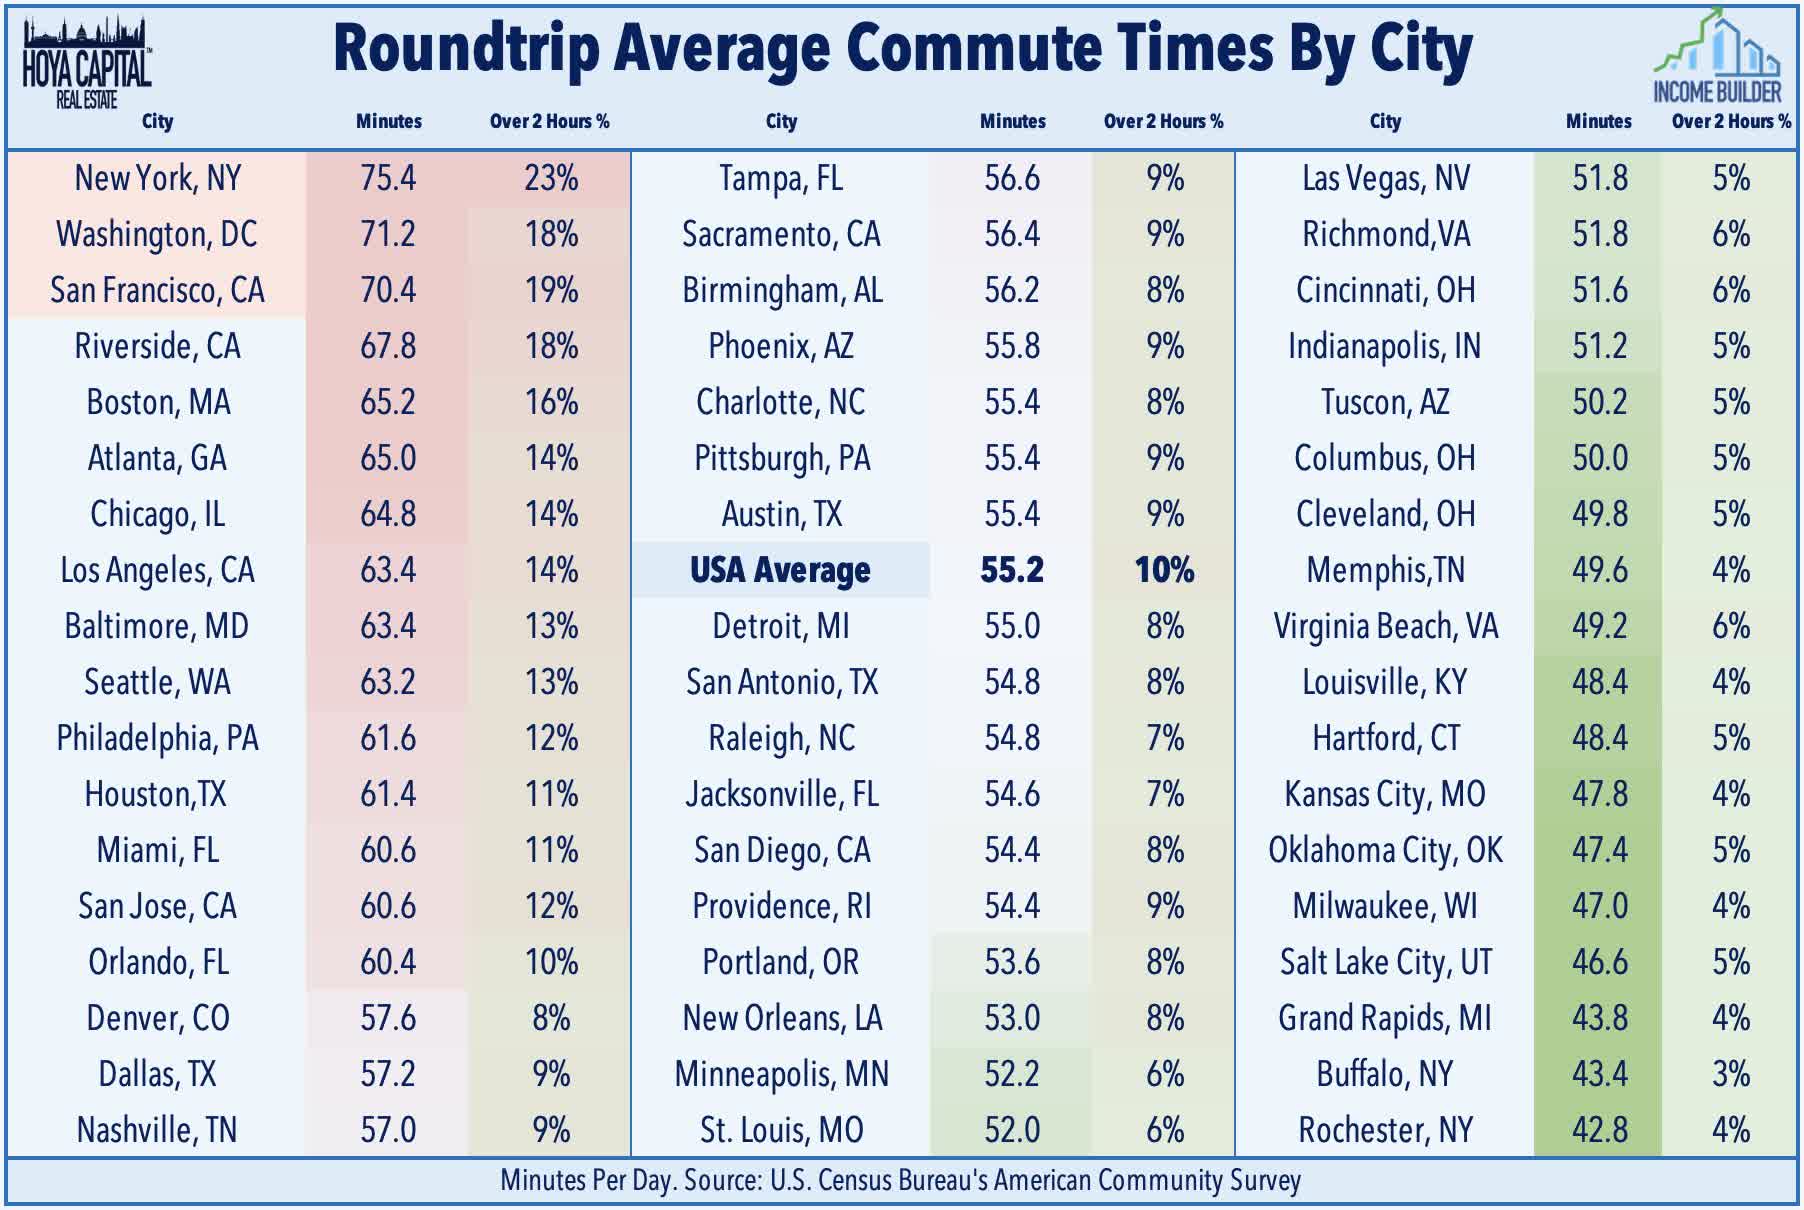
The damage is worst in urban areas with the longest commute times, as workers are more likely to demand, and get, telecommuting privileges. Los Angeles is among those hardest hit, with an average commute time of 63.4 minutes, and approximately 14% of workers commuting more than 2 hours.
Hoya Capital Income Builder
But suppose you had an Office REIT concentrated in L.A., that was designed specifically to make commuting short for the people who work in those offices? How would that company fare in today’s new normal?
This article examines growth, balance sheet, dividend, and valuation metrics for just such a company.
Meet the company
Douglas Emmett, Inc.
Founded in 1971 and headquartered in Santa Monica, Douglas Emmett Inc. (NYSE:DEI) went public as a REIT in 2006. The company owns and operates about 18 msf (million square feet) of Class A office space and more than 5000 luxury apartment units (average rent $3578 per month) in high-dollar areas of Los Angeles and Honolulu. These are glitzy properties.
Despite the high rent, the multifamily portfolio enjoys an occupancy rate of 99.2%, while the office portfolio is struggling, at just 82.9%.
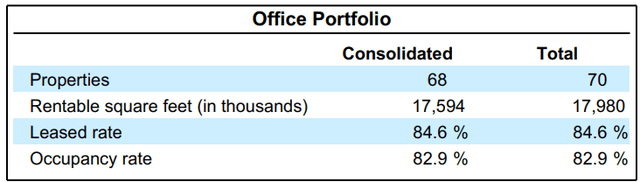
DEI Q2 2023 Earnings Package
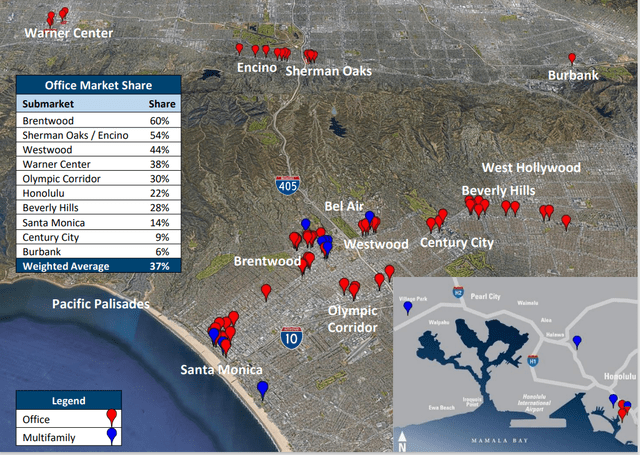
The properties fall into 10 submarkets, with 6 of these in West Los Angeles, 3 in the San Fernando Valley, and one in downtown Honolulu.
DEI investor presentation
These submarkets:
- are supply constrained,
- with high barriers to entry,
- have key lifestyle amenities,
- enjoy close proximity to high-end executive housing,
- have strong, diverse economic bases, and
- are dominated by small, affluent tenants.
DEI seeks substantial market share in each submarket, in order to gain local market information, pricing power in lease and vendor negotiations, economies of scale in property management, and an enhanced ability to identify acquisition opportunities. The company averages 37% of the Class A office space in its Los Angeles submarkets (including more than half in Brentwood and Sherman Oaks), and 22% of the Class A office space in downtown Honolulu. The company uses an integrated operating platform to provide the high level of customer service needed in these submarkets, with in-house leasing, proactive asset and property management, and internal design and construction services. This tends to minimize operating, G&A, and leasing costs. DEI leases typically include automatic rent escalators of 3 – 5%.
DEI’s office portfolio accounts for 80% of its total annual rent. By square footage, West L.A. accounts for 56%, with the Valley accounting for 38%, and Honolulu just 7%.
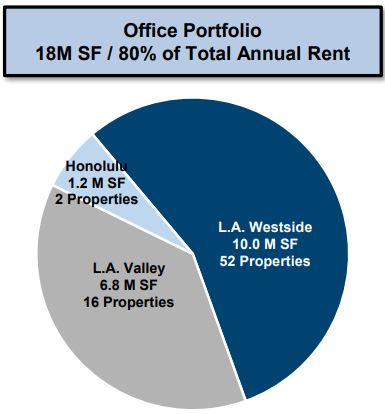
DEI investor presentation
The multifamily portfolio, which accounts for the other 20% of annual rental revenue, is almost evenly split between West L.A. and Honolulu, with none in the Valley.
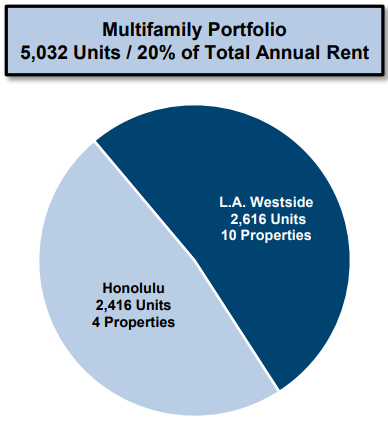
DEI investor presentation
Tenant diversification is extraordinary, with over 2700 leases, averaging just 2500 square feet each. Only 121 tenants lease more than 20,000 square feet.
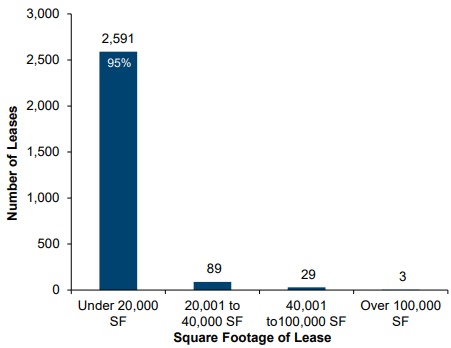
DEI investor presentation
And tenants are nicely diversified across industries, with legal offices, financial services, entertainment, and real estate combining for just over half of revenues.
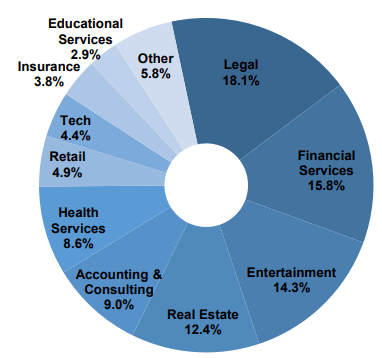
DEI investor presentation
Los Angeles is the third largest city in the world, with GDP of approximately $1 trillion, and a population of approximately 10 million. In addition to being a world entertainment capital, it is also the largest U.S. tech center, with over 350,000 jobs, and the largest U.S. manufacturing center, with more than 365,000 workers. Los Angeles also sports the largest U.S. Port, handling 44% of all containerized US imports. If that weren’t enough, L.A. also features the world’s largest higher education concentration, with more than 112 colleges and research universities. Unfortunately for DEI, this also means a higher percentage of residents with the tech savvy to office effectively from home.
Thanks in significant part to restrictive zoning laws and anti-growth sentiment in the community, total new supply of office space is lower in Honolulu and DEI’s Los Angeles submarkets than other selected gateway markets.
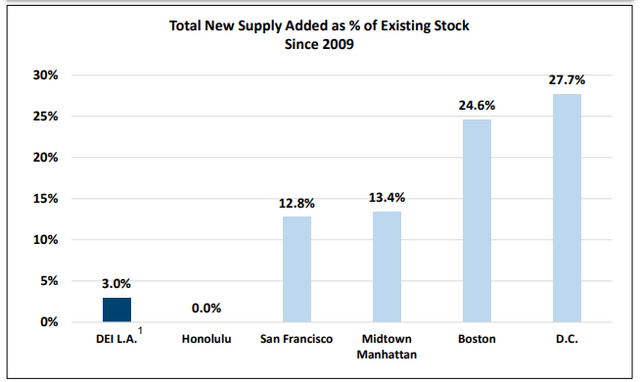
DEI investor presentation
In light of this, it is not surprising that DEI markets have seen the best cumulative rent growth over the past 25 years, compared to these same gateway markets.
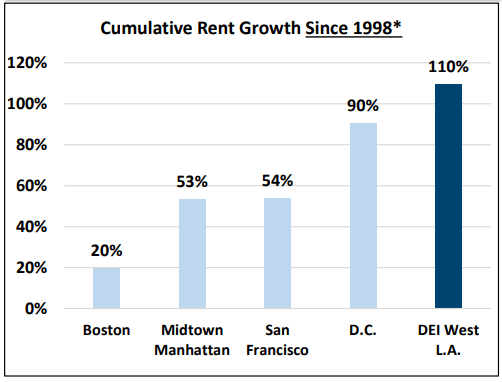
DEI investor presentation
Importantly, the positioning of DEI’s office assets creates much shorter commutes for people living in West L.A. than other areas of town. Because tenants usually live close to the office, they are willing to pay more and less likely to move to another office location — provided they believe they still need an office away from home.
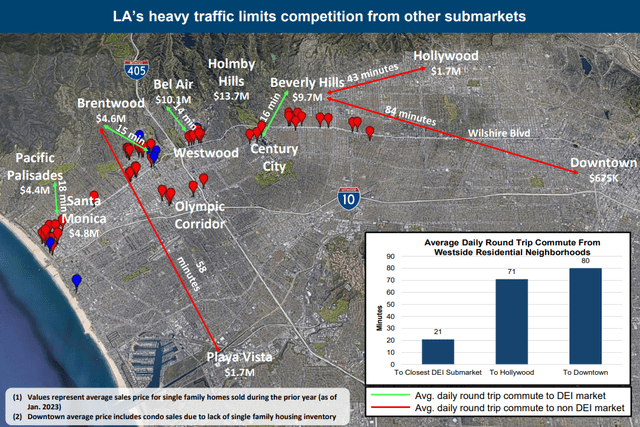
DEI investor presentation
This also results in fairly stable and consistent lease expirations year after year, usually floating between 11 and 15%, though expirations will reach nearly 20% next year.
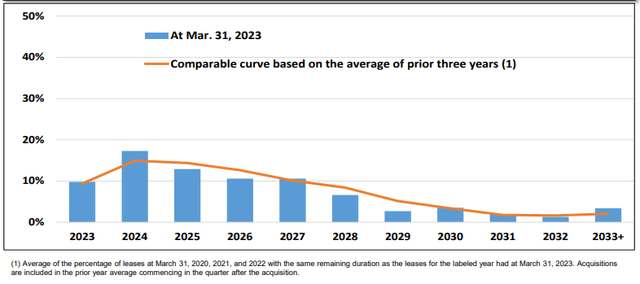
DEI investor presentation
Quarterly results
According to figures released by the company August 1, in Q2 2023:
- Revenues increased by 2.6%, thanks mostly to the multifamily portfolio.
- Net income decreased sharply, to a loss of (-$7.3) million, mostly due to accelerated depreciation and increased interest expense.
- FFO fell by (-8.4)% to $0.48 per share.
- AFFO fell by (-16.5)%.
- Same property cash NOI fell slightly, by (-0.9)% to $150.1 million, as higher multifamily revenues were offset by higher insurance, janitorial, and parking expenses.
- Straight-line office leasing spreads came in at 4.1% and cash leasing spreads at 6.6%
- Tenants are renewing earlier and for longer terms.
- The company is being forced to vacate a 712-unit apartment building in Brentwood to install new fire alarms.
- The company encumbered two of its properties to secure a $350 million loan at a variable rate of SOFR plus 1.37%.
- Repurchased 7.6 million shares at an average price of $12.13.
- DEI lowered guidance, now expecting a loss per share between ($0.13) and ($0.09), and FFO between $1.81 and $1.85.
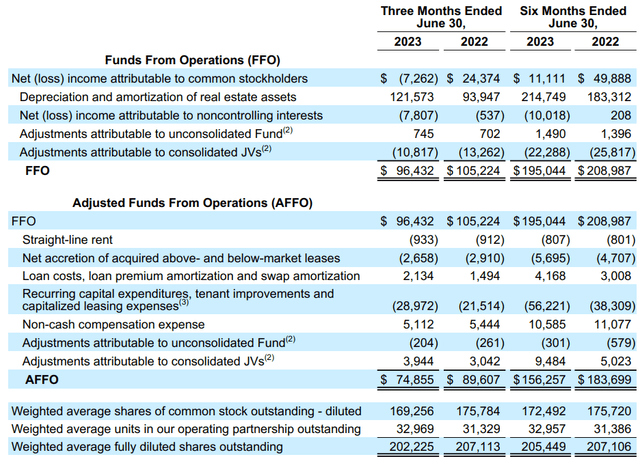
DEI Q2 2023 Earnings package
Growth metrics
Here are the 3-year growth figures for FFO (funds from operations), and TCFO (total cash from operations).
| Metric | 2019 | 2020 | 2021 | 2022 | 3-year CAGR |
| FFO (millions) | $425 | $373 | $383 | $420 | — |
| FFO Growth % | — | (-12.2) | 2.7 | 9.7 | (-0.4)% |
| FFO per share | $2.10 | $1.82 | $1.86 | $2.03 | — |
| FFO per share growth % | — | (-13.3) | 2.2 | 9.1 | (-1.1) |
| TCFO (millions) | $470 | $420 | $447 | $497 | — |
| TCFO Growth % | — | (-10.4) | 6.4 | 11.2 | 1.9% |
Source: TD Ameritrade, Hoya Capital Income Builder, and author calculations
The pandemic had a somewhat muted effect on DEI’s revenues and cash flow, and thanks to a nice bounce-back in 2022, revenues had basically recovered to pre-pandemic levels coming into this year.
Meanwhile, here is how the stock price has done over the past 3 twelve-month periods, compared to the REIT average as represented by the Vanguard Real Estate ETF (VNQ).
| Metric | 2020 | 2021 | 2022 | 2023 | 3-yr CAGR |
| DEI share price July 31 | $29.14 | $33.40 | $23.64 | $14.70 | — |
| DEI share price Gain % | — | 14.6 | (-29.2) | (-37.8) | (-20.4)% |
| VNQ share price July 31 | $81.39 | $106.29 | $98.96 | $85.26 | — |
| VNQ share price Gain % | — | 30.6 | (-6.9) | (-13.8) | 1.6% |
Source: MarketWatch.com and author calculations
DEI shares have underperformed the VNQ in each of the past three 12-month periods, rewarding investors with a dismal annual average return of (-20.4)%, compared to the VNQ’s small gain of 1.6%.
Since peaking just before COVID in 2020, DEI share prices have been seeking a bottom, dropping (-67.5)%. The stock’s all-time low was $6.45 during the Great Recession of 2009. Seventeen years in, DEI shares are selling for (-45.5)% less than they did in their IPO. Maybe this business model just doesn’t work.
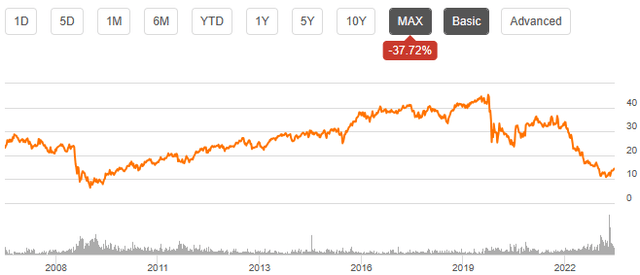
Seeking Alpha
Balance sheet metrics
In a sector characterized by shaky balance sheets, DEI stands out as a little worse than average. The debt ratio of 55% and Debt/EBITDA of 7.9 are all unwieldy.
| Company | Liquidity Ratio | Debt Ratio | Debt/EBITDA | Bond Rating |
| DEI | 1.74 | 55% | 7.9 | — |
Source: Hoya Capital Income Builder, TD Ameritrade, and author calculations
As of July 31, the company was holding $263 million in cash and equivalents, over against debts of $5.26 billion.
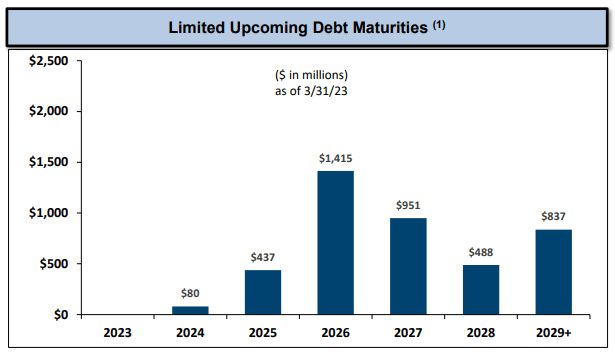
DEI investor presentation
Maturities are favorable, with nothing due until an $80 million payment in December 2024, followed by $437 million in 2025. The weighted average interest rate on the company’s fixed-rate loans is only 2.65%, but 25.1% of DEI’s debt is held at variable interest.
Dividend metrics
At first blush, DEI’s yield of 5.26% looks good, but when you consider that its dividend has shrunk over the past 5 years, going back even two years before the pandemic, it ends up looking pretty average, with a Dividend Score of 4.16, which is considerably below the Office REIT average of 4.99. If anything, the dividend is a little too safe at B+, according to Seeking Alpha Premium.
| Company | Div. Yield | 5-yr Div. Growth | Div. Score | Payout | Div. Safety |
| DEI | 5.26% | (-7.5)% | 4.16 | 40% | B+ |
Source: Hoya Capital Income Builder, TD Ameritrade, Seeking Alpha Premium
Dividend Score projects the Yield three years from now, on shares bought today, assuming the Dividend Growth rate remains unchanged.
Valuation metrics
DEI is priced about like the typical Office REIT, at 7.7x FFO ’23, but offers only a (-9.7)% discount to its NAV of $16 per share, which is barely half the discount for the average REIT.
| Company | Div. Score | Price/FFO ’23 | Premium to NAV |
| DEI | 4.16 | 7.7 | (-9.7)% |
Source: Hoya Capital Income Builder, TD Ameritrade, and author calculations
Hoya Capital estimates DEI would be fairly priced at about $14.00 per share.
What could go wrong?
Because DEI’s assets are concentrated in two small geographic areas, changes in those local economies, or natural disasters affecting them, could have an outsized impact on DEI revenues.
DEI has a large share of variable-rate debt, and just took on more in Q2. Interest expense is already cutting noticeably into profitability, and there appears to be no end in sight, even if the Fed is done raising interest rates. If rates continue to go up, the situation will only get worse. Meanwhile, the company’s FFO is going south, and expected to get worse.
Investor’s bottom line
Douglas Emmett insiders have considerable confidence in the company’s future, having bought $124,000 worth of shares in the past 3 months. The company was already expecting significant erosion in FFO over the coming two years, however, even before lowering guidance for this year in reporting Q2 results. Interest expense on variable-rate debts are eating the company’s lunch. There do not seem to be any growth catalysts, and although the company should be fine for a while yet, there are better places to park your money, even if all you want is an Office REIT. I rate DEI a Sell.
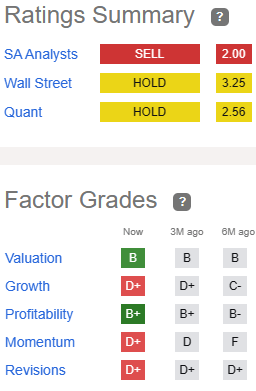
Seeking Alpha Premium
The Street and Zacks also rate DEI a Sell, but Ford Equity Research and TipRanks are Neutral on the stock. Meanwhile, 6 of the 12 Wall Street analysts covering the firm rate it a Hold, with 4 saying Buy and 2 saying Sell. The average price target is $13.59, implying (-6.0)% downside.
However, as always, the opinion that matters most is yours.
Read the full article here

