Part I – Introduction
Houston-based EOG Resources, Inc. (NYSE:EOG) released its second quarter 2023 results on August 3, 2023.
Important note: This article updates my preceding article, published on July 11, 2023. I have followed EOG on Seeking Alpha since 2016.
EOG Resources produces from five Premium Basins and is a pure-play U.S. producer with a small production from Trinidad.
CEO Ezra Yacob said in the conference call:
Our second quarter results reflect exceptional execution throughout our multi-basin portfolio. Production volumes, CapEx, cash operating costs and DD&A all beat targets driving another quarter of excellent financial performance.
1 – 2Q23 Results Snapshot And Commentary
EOG Resources reported a second-quarter 2023 adjusted earnings per share of $2.49, beating analysts’ expectations. The results were lower than the year-ago quarter’s adjusted earnings of $2.74 per share.
Total quarterly revenues increased to $5,573 million from $7,407 million in 2Q22.
EOG 2Q23 Highlights (EOG Presentation)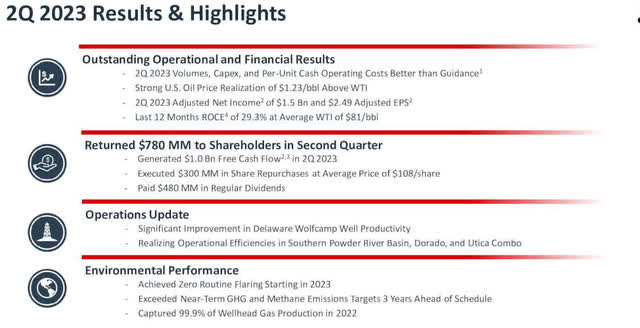
EOG Resources’ total volumes increased 6.8% YoY to 88.3M Boepd on higher U.S. production or 970.3K Boepd. The company expected production between 902.6K and 939.4K Boepd for the First quarter 2023.
The quarter’s crude oil and condensate production totaled 476.6K Boepd, up 2.4% from the year-ago level. Natural gas liquids volumes increased by 6.8% yearly to 215.7K Bbls/d. Natural gas volume rose to 278K Boepd from the year-earlier quarter’s 254.7K Boepd.
EOG 2Q23 Production Oil, NGL, NG (Fun Trading)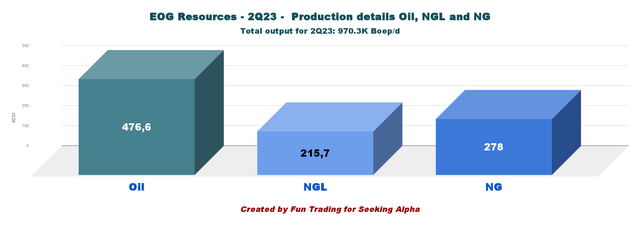
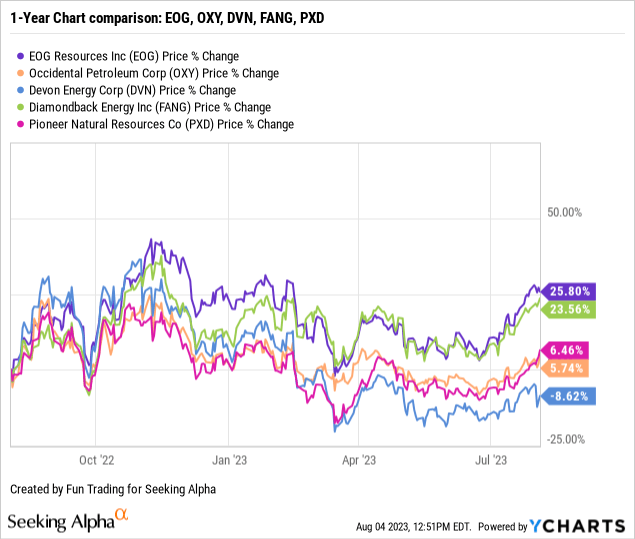
2 – Stock Performance
All five companies in the chart below have dropped significantly since November 2022. However, EOG is up 13% on a one-year basis.
EOG Resources produces oil and gas from its U.S. shale assets, representing 97.0% of the total output in 1Q23. The production from the U.S. comes from five basins: Bakken, Powder River, Wyoming DJ, Delaware, and Eagle Ford (including the dry gas play Dorado).
EOG 2Q23 Production per Region (Fun Trading) Production in the USA was up 6.5% from the same quarter a year ago.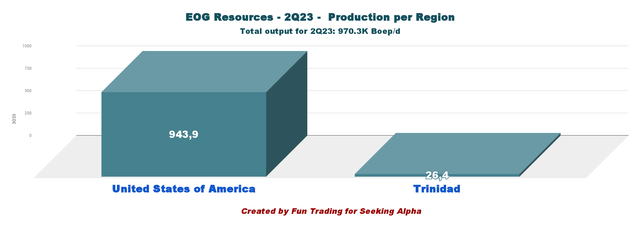
| Production per Region in K Boep/d | 2Q22 | 3Q22 | 4Q22 | 1Q23 | 2Q23 |
| United States of America | 886.1 | 891.6 | 883.8 | 915.1 | 943.9 |
| Trinidad | 34.6 | 27.6 | 25.3 | 27.9 | 26.4 |
| TOTAL | 920.7 | 919.2 | 909.1 | 943.0 | 970.3 |
Part II – EOG Resources – 2Q23: Balance Sheet History. The Raw Numbers
| EOG Resources | 2Q22 | 3Q22 | 4Q22 | 1Q23 | 2Q23 |
| Total Revenues in $ million | 8,645 | 7,598 | 6,494 | 5,579 | 5,460 |
| Oil Revenues in $ Million | 7,407 | 7,593 | 6,719 | 6,044 | 5,573 |
| Net income in $ Million | 2,238 | 2,854 | 2,277 | 2,023 | 1,553 |
| EBITDA $ Million | 3,841 | 4,610 | 3,779 | 3,435 | 2,887 |
| EPS diluted in $/share | 3.81 | 4.86 | 3.87 | 3.45 | 2.66 |
| cash from operating activities in $ Million | 2,048 | 4,773 | 3,444 | 3,255 | 2,277 |
| Capital Expenditure in $ Million | 1,424 | 1,205 | 1,362 | 1,624 | 1,521 |
| Free Cash Flow in $ Million | 624 | 3,568 | 2,082 | 1,631 | 756 |
| Total cash $ Billion | 3.07 | 5.27 | 5.97 | 5.02 | 4.76 |
| Long-term debt in $ Billion | 5.09 | 5.08 | 4.86 | 3.82 | 3.81 |
| Dividend per share in $ (+ special dividend) | 0.75+1.70 | 0.825+1.50 | 0.825+1,00 | 0.825 | 0.825 |
| Shares outstanding (diluted) in Million | 588 | 587 | 587 | 587 | 584 |
Source: EOG Resources.
Part III – Analysis: Revenues, Earnings Details, Net Debt, Free Cash Flow, And Oil Equivalent Production
1 – Total Revenues And Others Were $5,573 Million in 2Q23
Note: Oil revenues were $5,460 million in 2Q23.
EOG Quarterly Revenues History (Fun Trading)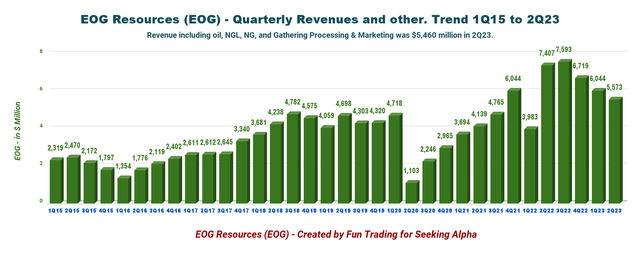
The company’s net income was $2,023 million, or earnings per share of $3.45, compared to $390 million or $0.67 per share a year ago.
Total operating expenses in 2Q23 were $3,603 million, lower than the $4,604 million a year ago.
Transportation costs increased to $244 million from $236 million a year ago. Also, Lease and well expenses increased to $348 million from $324 million a year ago. Finally, the company reported gathering and processing costs of $160 million, higher than the year-ago quarter’s $152 million.
Earnings were better than expected due to higher oil equivalent production, reaching 970.3K Boepd.
2 – Free Cash Flow Was $756 million in 2Q23
EOG Quarterly Free Cash Flow History (Fun Trading)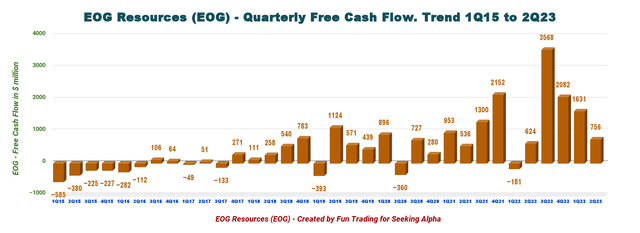
Note: The organic free cash flow is the cash from operating activities minus CapEx. EOG uses another way to calculate the generic Free cash flow, which is not comparable to other E&P companies and indicated $1,042 million.
The generic free cash flow for the second quarter of 2023 was $756 million, and the trailing 12-month free cash flow was $8,037 million.
EOG Resources declared a regular quarterly dividend of $0.825 per share and repurchased $300 million of shares during the second quarter.
3 – Oil-Equivalent Production And Other
3.1 – Oil Equivalent Production
EOG Resources’ oil production increased sequentially in the second quarter. Total production was a record of 970.3K Boepd, up 5.4% from last year and up 2.9% sequentially. The chart below shows that the entire production reached a record this quarter.
EOG Quarterly Production History (Fun Trading)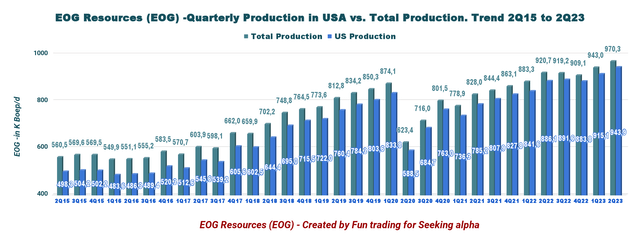
CFO Tim Driggers said in the conference call:
EOG delivered excellent operating and financial performance in all areas in the second quarter. Oil production increased 3% year-over-year while total production increased 5%. Per unit cash operating costs remained essentially flat from the prior year period despite industry wide inflation.
3.2 – Oil Production Detail: Oil, NGL, And NG
EOG relies significantly on crude oil, representing 49.1% of the total output 2Q23.
EOG Quarterly Oil and Gas Production History (Fun Trading)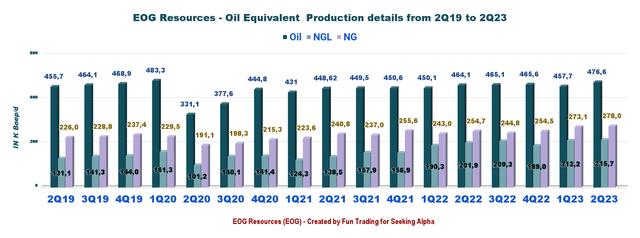
The company’s oil price (composite) realized this quarter was $74.98 a barrel, down from $111.25 a year ago.
In addition, natural gas was $2.20 per Mcf, a decline of 30.6% YoY. Finally, NGL prices were $20.85 per barrel, declining significantly from $42.28.
CEO Ezra Yacob said on the conference call:
Oil demand has been resilient despite volatility in the first half of the year, and demand is showing signs of continued growth through the second half of the year. Strong inventory drawers since the start of the year have pulled oil inventories below five year averages and refinery utilization remains high.
Below is the chart history of the Oil and NG price composite.
EOG Quarterly Oil and Gas History (Fun Trading)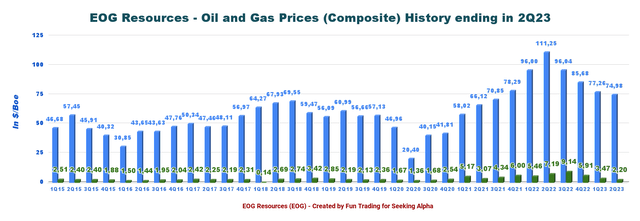
4 – No Net Debt and good Cash position. Excellent Profile with net cash of $950 million in 2Q23.
EOG Quarterly Cash versus Debt History (Fun Trading) As of June 30, 2023, EOG Resources had cash and cash equivalents of $4,764 million. Long-term debt was reported at $3,814 million, down from $5,091 million in 2Q22. The current portion of the long-term debt was recorded at $34 million this quarter. The next maturity is a $500 million bond due April 2025. EOG is net debt-free.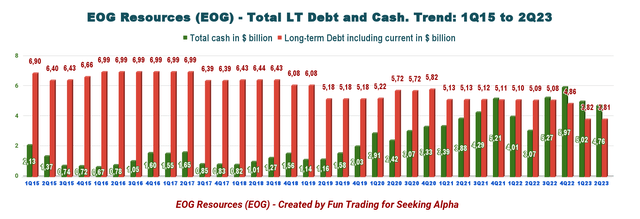
5 – 3Q23 and 2023 Guidance
For 2023, EOG Resources forecasts total production between 965.0K-991.5K Boepd, representing an increase of 7.7% (mid-point) from what was reported in 2022 or 908.2K Boep/d.
The company’s CapEx is expected to be $5,800-$6,200 million for the year, with $1,560-$1,760 million likely used in the third quarter.
For 2Q23, the company expects production of 954.4K-990.8K Boepd, up 0.2% sequentially.
Part IV – Technical Analysis And Commentary
EOG TA Chart Short-term (Fun Trading StockCharts)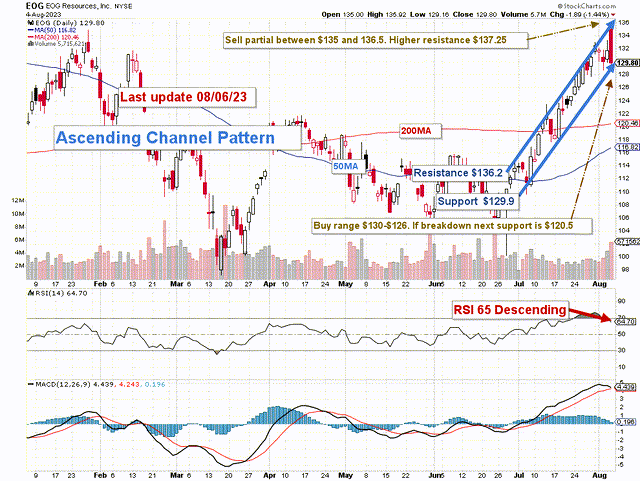
Note: The chart has been adjusted for dividends.
EOG forms an ascending channel pattern with resistance at $136.2 and support at $129.9. RSI is 65, approaching overbought territory.
Generally, ascending channel patterns are short-term bullish, but these patterns often form within longer-term downtrends as continuation patterns, which means a retracement is expected soon.
The short-term trading strategy is to trade LIFO for about 60% of your position. I have increased the short-term portion due to the overbought situation.
However, EOG Resources is an excellent domestic E&P with outstanding assets run by solid management. I do not recommend trading more than 60% of your position.
I suggest selling between $135 and $136.5 with higher resistance at $137.25 and waiting for a retracement between $126 and $130 with possible lower support at $120.5.
Watch oil and gas prices like a hawk.
Warning: The TA chart must be updated frequently to be relevant. It is what I am doing in my stock tracker. The chart above has a possible validity of about a week. Remember, the TA chart is a tool only to help you adopt the right strategy. It is not a way to foresee the future. No one and nothing can.
Read the full article here

