
Thesis
Fidelity Blue Chip Growth ETF (BATS:FBCG) is an actively managed ETF that picks large-cap growth stocks. As a relatively new fund, the track record doesn’t have much to say as to how it would behave in different market environments.
However, I believe we have enough to say that long-term investors have better options available if they are looking for growth. While the ETF may outperform competing ones during a bull trend, its active management nature and fees can be a major drag in the long term.
Overview
| Launch Date | Feb 6, 2020 |
| Issuer & Manager |
Fidelity Management & Research Company LLC |
| AUM | $751.73M |
| Benchmark |
Russell 1000 Growth Index |
| Goal | Outpacing |
| Holdings | 169 |
| Market Cap Target | Large |
| Weighting | Discretionary |
FBCG aims to track growth in U.S. equities, mainly focusing on larger companies. Its goal is to identify firms with solid earnings potential that are underestimated by the market coupled with a catalyst that could reveal their actual value, prioritizing opportunities represented by companies with competitive edges and strong management. Of course, the vagueness in the fund’s methodology is justified by a cautionary attitude as there is a possibility that others can copy its strategy and hinder its performance.
Just a few thoughts before we move on. First, I always find it intriguing that actively managed funds will try to beat an index and at the same time focus on large market-cap and adequate diversification (currently 169 stocks in the fund’s portfolio). These things lower their chances of outpacing the benchmark in the long term, but they ensure they can handle as many assets as investors can give them. So, I’m always a bit skeptical when it comes to comes to “growth” ETFs that try to beat growth indices. With that being said, I will try to keep my prejudice in check; but I wanted to be completely transparent before you read this review.
Also, I think we have enough data to meaningfully assess FBCG right now, but because it has been operating for only a couple of years, I’ll have to admit that I may miss the big picture; usually, I prefer a track record of at least two decades when it comes to ETFs to make a capital allocation decision. That’s another factor that can influence my decision-making and my review, but I promise to be as objective as possible and be content with what we do have to analyze.
Allocations
fidelity.com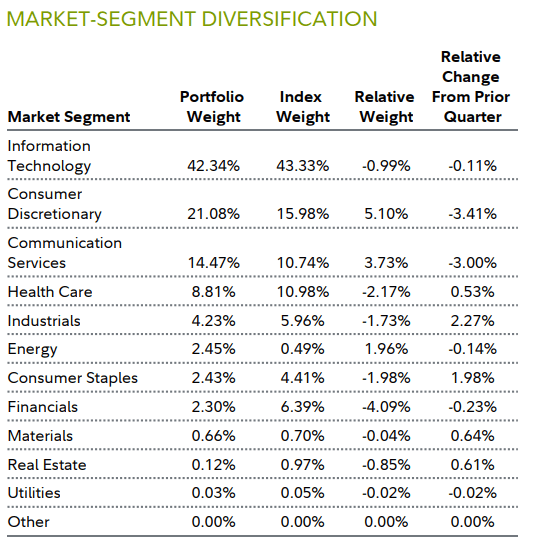
First of all, the fund seems to tilt towards Information Technology quite substantially, with 42.34% allocated to companies in the sector. However, the benchmark is also concentrated into it to about the same degree.
One major difference is that the ETF is more exposed to the top 3 sectors aggregated than its benchmark. It is interesting to also note that it’s way more exposed to Energy while being way less exposed to Real Estate.
fidelity.com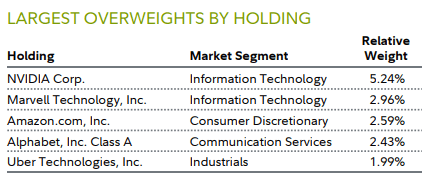
That said, I don’t find FBCG significantly concentrated in a single stock, with NVIDIA Corp. (NVDA) having the highest relative weight of 5.24%.
Cost
| Ticker | Expense Ratio | Turnover | Daily Volume |
| FBCG | 0.59% | 57% | 140,107 |
| PWB | 0.55% | 123.00% | 19,088 |
| FTC | 0.59% | 121% | 107,355 |
| TCHP | 0.57% | 17.30% | 39,222 |
| VUG | 0.04% | 5% | 717,615 |
| IWF | 0.19% | 14% | 1,048,860 |
| IVW | 0.18% | 34% | 2,798,222 |
| SCHG | 0.04% | 8.73% | 1,079,101 |
| MGK | 0.07% | 5.00% | 390,019 |
| VOOG | 0.10% | 12.80% | 159,356 |
| IWY | 0.20% | 12% | 174,772 |
| RPG | 0.35% | 45.00% | 241,553 |
In the above table, there are both active and passive management funds that aim at large-cap growth stocks. FBCG is relatively expensive to hold at a 0.59% expense ratio, but it sure is reasonable for an actively managed fund. I find its liquidity adequate, but its most recently reported turnover of 57%, though not surprising, can be a significant factor when it comes to cost for long-term investors.
The Vanguard Growth Index Fund ETF Shares (VUG) seems to be the best choice for long-term investing. It charges 0.04% and its latest reported turnover was 5%. Trading volume seems to be relatively high as well for it too. And as you will be able to see in the next section, its relative performance is promising.
Performance
fidelity.com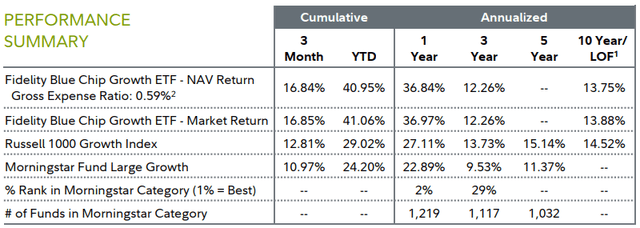
Since its inception, FBCG has returned an average annualized price return of 13.88%, a period during which its benchmark noted a 14.52% return. Since one year ago, the ETF outperformed the index, realizing a 36.97% price return versus the benchmark’s 27.11%.
The track record is too short to convey a very meaningful message here, but at least I don’t see any red flags. The underperformance since launch is small enough to let the recent outperformance counterweight it. It’s in fact possible that FBCG pleasantly surprises us in the future.
Taking into perspective the exact years during which we have seen it in action, it seems more volatile than the index. This is more clear in the chart below which compares FBCG to the iShares Russell 1000 ETF (IWB) which tracks the index:
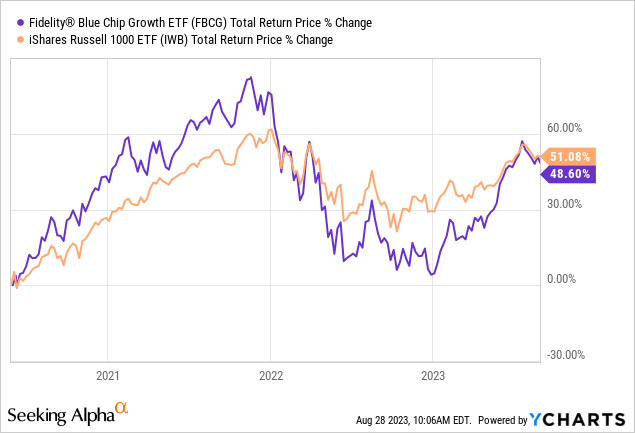
So, it’s not unreasonable to expect that during a strong bullish trend, this ETF may be a good way to gain exposure for a trader as opposed to other less volatile growth funds. Speaking of which:
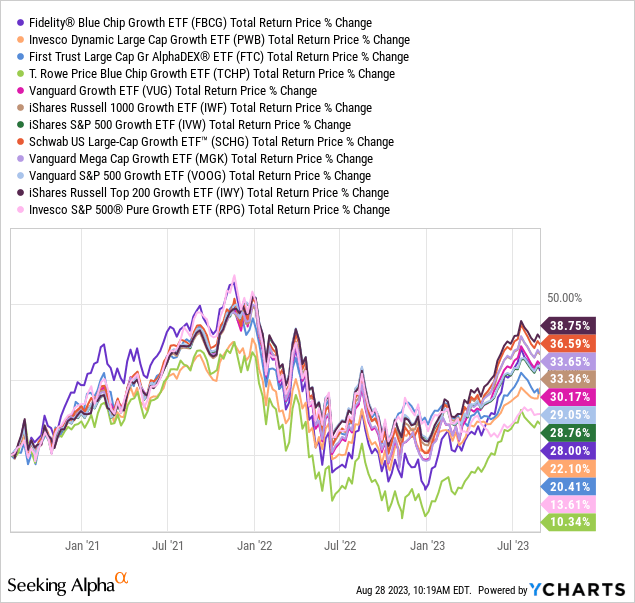
Compared to other large-cap growth ETFs, FBCG again seems the most volatile one. And that’s the only thing you should take from here because while the specific period captures this well, the returns are likely to look so much different in the short term.
| Ticker | CAGR | Stdev | Max. Drawdown | Sharpe Ratio |
| FBCG | 6.81% | 25.41% | -39.90% | 0.32 |
| PWB | 4.43% | 19.77% | -29.40% | 0.24 |
| FTC | 7.08% | 20.21% | -28.46% | 0.36 |
| TCHP | 2.00% | 22.69% | -38.98% | 0.13 |
| VUG | 7.81% | 22.10% | -33.15% | 0.38 |
| IWF | 8.71% | 21.08% | -30.75% | 0.43 |
| IVW | 7.15% | 20.75% | -30.45% | 0.36 |
| SCHG | 9.76% | 22.08% | -31.80% | 0.46 |
| MGK | 8.27% | 22.66% | -33.59% | 0.39 |
| VOOG | 7.21% | 20.83% | -30.47% | 0.36 |
| IWY | 9.53% | 21.47% | -30.68% | 0.46 |
| RPG | 3.67% | 22.65% | -31.66% | 0.2 |
Indeed, in the last couple of years, FBCG realized a 6.81% CAGR at a 25.41% standard deviation. Notably, its maximum drawdown was -39.90%. Though there are 3 funds whose risk-adjusted returns look even worse, 8 had a higher Sharpe than FBCG.
Risks
One risk you should know about is that with an expense ratio of 0.59% and active management, it’s possible to end up underperforming its vanilla counterpart in the long term. The iShares Russell 1000 ETF, which tracks the index FBCG aims to beat, charges 0.15% instead. Also, FBCG had a turnover of 57% during the latest fiscal year, while IWB reported 5%. It’s not far-fetched that these substantial differences can contribute to possible underperformance if you buy FBCG.
Another risk relates to the concentration in the Information Technology sector. The managers may be expecting more growth coming from that area of the market, but it’s nonetheless true that the fund will be very sensitive to that sector’s changes.
Verdict
In conclusion, I think that FBCG may be more suitable for short-term exposure to growth stocks. Based on the information that we do have available, I am worried that the fees and turnover will significantly add up in the long term. For investors looking to hold for years, a fund like VUG looks more appropriate.
That’s just me though. You may have a good reason to see things differently. What is your opinion? Let me know in the comments. And as always, thank you for reading.
Read the full article here

