
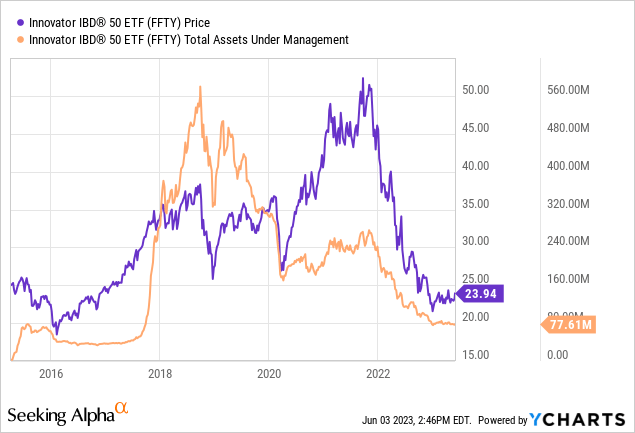
The Innovator IBD 50 ETF (NYSEARCA:FFTY) is a quasi-actively managed fund I attempt to cover at least every three months. At this juncture, the fund has only $77.6 million in AUM, which has been declining for a few years already after touching an all-time high in 2018.
As described on the fund’s website, the weekly rebalanced & reconstituted IBD 50 Index is the bedrock of its strategy. The index in turn adheres to the principles of the CAN SLIM Investing system. I believe it is worth shortly quoting the investor guide here for better context,
The IBD 50® methodology is based on legendary investor, and IBD® founder William J. O’Neil’s groundbreaking analysis which marries both fundamental and technical research to create a tactical, high conviction list of growth stocks.
In a nutshell, fundamental and technical data are assessed from a few angles to pick just 50 worthiest stocks from the universe encompassing about 7,000 names (ADRs are shown the green light). I recommend looking at the documents presented on the FFTY website for a deeper understanding of the core principles at the foundation of its strategy, key risks, etc.
Since the first note published in August 2022, I have been a permanently skeptical analyst when it comes to FFTY’s high-turnover approach to portfolio management. The gist is that while boasting a labyrinthine and seemingly perfectly crafted strategy, FFTY has been constantly surprising to the downside. More specifically, since its inception in April 2015, it beat the iShares Core S&P 500 ETF (IVV) only once, in 2017, by 15.9%, and delivered a total return almost on par with it in 2020. Since my most recent note published in February 2023, the fund has again underperformed the S&P 500 index, which has risen by about 2.4% while the ETF has been stagnant.
Seeking Alpha
Today, I would like to review its portfolio changes since February and explain why it would be wrong to upgrade the fund to a Buy.
How has the portfolio changed since the previous coverage?
The FFTY portfolio is constantly adjusted in line with the IBD 50 index weekly reconstitutions. More specifically, as I am looking at portfolio versions from time to time, I have made the following comparisons,
- First, only ~43.5% of the June 1 FFTY portfolio were present in the May 2 version. Among notable removals over that period were Meritage Homes (MTH), Tecnoglass (TGLS), and Arista Networks (ANET) which combined accounted for almost 11%. Amongst the additions worth mentioning are Axcelis Technologies (ACLS), a semiconductor equipment company, Rambus (RMBS), another semiconductor name, and monday.com (MNDY), a Tel Aviv-based project management software company, together with a ~11.4% weight. Interestingly, the fund had exposure to ACLS in February, then removed it at some point before May 2, and then bought into the stock again.
- Second, the holdings overlap between May and February portfolios was just 28.4%, indicating that only 11 stocks from the earlier version could be found in the basket on May 2.
- And third, the June version contains only about 16.3% of the FFTY equity basket as of February 6, namely just six stocks, including the above mentioned Axcelis. That is to say, the portfolio has been almost entirely rebuilt in just a few months. Small wonder FFTY’s turnover is 1,961%. And that is the principal reason why I prefer to call a strategy like that a ‘quasi-active’ one.
Delving deeper, perhaps the most noteworthy development is that the earnings yield has cratered, now at only around 1.8% vs. approximately 9.3% in February, as per my calculations. The impact of loss-making companies in this mix is now much more noticeable than before, with the contribution at ~47.2% vs. ~12.7%. The weighted-average Return on Equity of 20 bps is also fairly telling.
The decline in the EY was assisted only by a small reduction in the weighted-average market cap, to $22.8 billion, as FFTY still has a little interest in mega caps (with a combined weight of 4.8%, as shown below), with no exposure to the $1 trillion league, at all.
| Stock | Weight as of June 1 | GICS Sector | Market Cap | SA Quant Valuation | SA Quant Profitability | EY |
| Broadcom (AVGO) | 1.16% | Information Technology | $335 billion | D- | A+ | 3.8% |
| ASML Holding (ASML) | 0.53% | Information Technology | $280 billion | F | A+ | 2.6% |
| Salesforce (CRM) | 2.09% | Information Technology | $218.7 billion | C- | A+ | 0.1% |
| ServiceNow (NOW) | 1.06% | Information Technology | $110.9 billion | D | A | 0.4% |
Created by the author using data from SA and the fund
Overall, it is obvious that FFTY’s stock mix has become significantly pricier as the share of stocks with a D+ Quant Valuation grade or lower is now ~76.7% vs. 43.5% in February.
The silver lining is that the minuscule earnings yield is backed by an over 46% forward EPS growth rate (Copa Holdings (CPA) and Snowflake (SNOW) are the leading contributors), as per my calculations, while a 35.3% forward revenue growth rate somewhat supports an 8.8x Price/Sales ratio. All these make me conclude the fund is now in a maximalist growth/value-agnostic mode with a noticeable tilt towards the IT sector, now accounting for 31% of the net assets. Another way of saying, it seems FFTY is catching up with the AI hype.
| Metric (weighted-average) | 6 February | 1 June |
| Market Cap | $26.4 billion | $22.8 billion |
| Earnings Yield | 9.3% | 1.8% |
| EPS Fwd | 27.7% | 46.1% |
| Revenue Fwd | 29.65% | 35.32% |
Calculated by the author using data from SA and the fund
At the same time, the ETF has become implicitly bearish on the energy sector as it removed all the energy holdings from the portfolio, namely Hess (HES), Par Pacific (PARR), PBF Energy (PBF), Matador Resources (MTDR), HF Sinclair (DINO), and Tenaris (TS). The sector accounted for around 9.2% in February, also being one of the main contributors to FFTY’s value factor exposure (i.e., its previously strong EY). The fund still ignores the real estate and utilities sectors, while it has added one consumer staples stock (Celsius Holdings (CELH), 3.3% weight).
FFTY sector allocation changes, February – June 2023 (Created by the author using data from FFTY, iShares Russell 3000 ETF, and Seeking Alpha)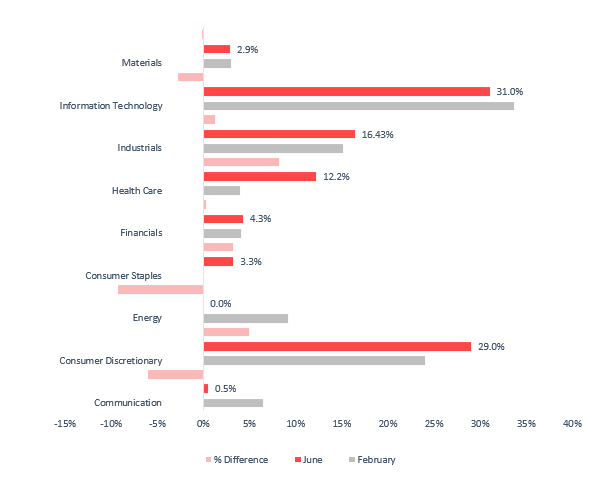
A closer look at performance: an uneven recovery after cataclysmic 2022
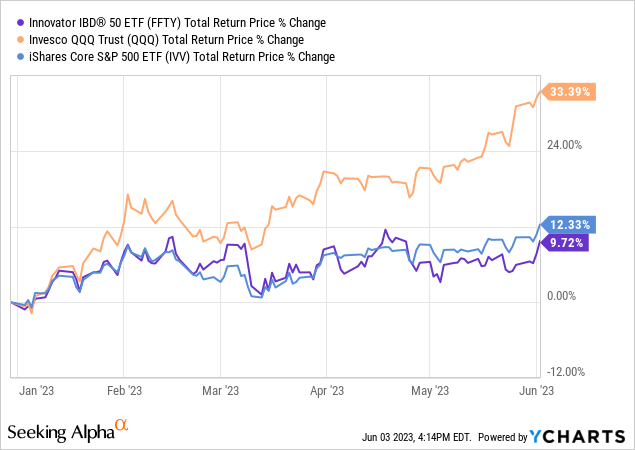
The key disappointment is that FFTY not only saw an appalling performance in 2022 but has also been recovering at a slower pace compared to IVV and Invesco QQQ (QQQ) ETFs this year.
At the same time, its CAGR over the May 2015 – May 2023 period is negative.
| Portfolio | FFTY | IVV | QQQ |
| Initial Balance | $10,000 | $10,000 | $10,000 |
| Final Balance | $9,781 | $23,274 | $34,473 |
| CAGR | -0.27% | 11.02% | 16.54% |
| Stdev | 22.35% | 15.87% | 19.44% |
| Best Year | 37.63% | 31.25% | 48.40% |
| Worst Year | -52.40% | -18.16% | -32.58% |
| Max. Drawdown | -56.57% | -23.93% | -32.58% |
| Sharpe Ratio | 0.05 | 0.67 | 0.83 |
| Sortino Ratio | 0.07 | 1.01 | 1.35 |
| Market Correlation | 0.83 | 1 | 0.91 |
Created by the author using data from Portfolio Visualizer
Final thoughts
As I pointed out in the previous note, FFTY has an intricate, labyrinthine index-based strategy with a focus on growth stocks that might look exceedingly alluring upon cursory inspection. Its extremely high-turnover approach should be another benefit as following the index recalibration, the fund can get rid of losers as quickly as possible and rotate into winners to maximize returns and benefit from the prevailing market sentiment. Unfortunately, the first impression is oftentimes misleading.
Interestingly, FFTY has a Strong Sell Quant rating, with utterly lackluster Momentum (a D- rating at the moment) being among contributors. The situation has hardly changed since February when the ETF also had such a sluggish performance that it was F-rated.
Seeking Alpha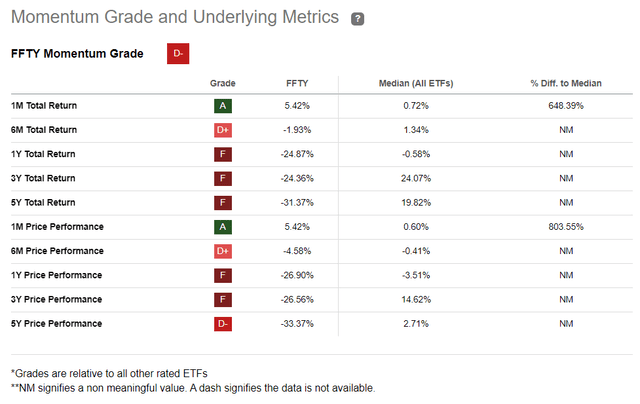
Besides, I should also repeat that the expense ratio of 80 bps looks a bit too high assuming inconsistent performance. In sum, the Hold rating is maintained.
Read the full article here

